Program Trading: Strong/Weak Stock Selection

I looked back through the prior posts in this thread as we now need to add a proper algorithm for sorting weak/strong stocks.

First suggestion was comparative strength. I put the code from the recommended Tradestation link (https://www.tradestation.com/Discussions/Topic_Archive.aspx?Topic_ID=22476) into our #TT_RATE_WEAKSTRONG

Code:
// This indicator calls a function which gives a strength rating
// it then calls TT_SET_ARRAY to store this strength rating in an 'array' of 
// global variables 
inputs: avglen(30); 

Vars : ReturnCode(0),RelativeStrength(0), relstrengthcomp(0),avgrelstrcomp(0), INDUClose(0),normalizevalue(0); 
// Call a function to analyze the strength/weakness of a stock and produce a value

// As $INDU is our baseline, we should store info on that in GVs
// Store Close of Indu or get it 


if GetSymbolName = "$INDU" then begin
	ReturnCode = GVSetNamedFloat("TTInduClose",Close);
	INDUClose = Close;
end
else
	INDUClose = GVGetNamedFloat("TTInduClose",1);

// if INDUClose isn't set yet - skip this. There's no guarantee $INDU will be processed first
// ... or is there ???

if INDUClose <> 1 then begin
if date <> date [1] or barnumber=1 or INDUClose[1] = 1 then
		normalizevalue = 1/(close/INDUClose); 
	relstrengthcomp = (close/INDUClose)*normalizevalue; 
	RelativeStrength = average(relstrengthcomp,avglen); 

// Now call a function to put this data away for use at trade time

	ReturnCode = TT_SET_ARRAY(RelativeStrength);

//Plot the relative strength

	Plot1(RelativeStrength,"Strength");
end;

I'm not publishing the ESL for this as it didn't quite work out the way I thought it would...

attachment.php


Is this a case of me having the incorrect algorithm for comparative strength or is comparative strength just not a great indicator ? Should I have not included the normalised code in there ?

Also - it was mentioned that we'd only check the last 30 minutes but the N Minute change checks the whole day. Any thoughts on that ?

Should we return to some ATR type of calculation or have I done somehting dumb with comparative strength ? Just the ranges of values it returns make it hard to pick the top 4 or 5 from 50 or so stocks....

Pete

PS - I was off line when I ran this so that may be the issue here. I'll run it again when I'm on-line back at the hotel. The company firewall here blocks access to the ports that TS uses.
I seem to recall that the comparative relative strength was a very simple calculation
price of stock divided by price of $INDU - could be expressed as a percentage. Thus $INDU will always be 1 or 100%. However to make it equivalent to what we do in N min change we might also be interest in a movement over a period. So we would look at whether the stocks price had moved more or less than $INDU within a period.

To make a comparison to N min change we would have to look at the change in the comparative relative strength over over a 14 bar period for the same data compression as N min change I believe.

On the subject of the total period over which the N min change covers, the changing data compression we apply each 14 mins is designed to make the sorting of the Radar screen look back to market open, because of the constantly changing bar length.

Personally I am not entirely convinced about going back to market open, because if the volatility has altered significantly during the day, then I would have thought that it is better to limit the calculation to a more recent time period.

Charlton
 
This is also of interest
- from the linked thread I read that it's based on stocks hitting 52 week highs/lows. Is that right ?
- how do we reverse this to find weak stocks ???
- how do we turn this into an algorithm so we can code it ?

Cheers

Pete

Personally I would say this is fine for finding candidates for swing trading using something like FINVIZ to filter out these. Alternatively these could be chosen as the initial population for daytrading. However if we started with a population of, say, 50 stocks on Radarscreen, there is no guarantee that any single one would reach a 52 week high or low during the session. So I don't think it should form the main sorting criteria for daytrading, but it could be part of a condition something like - sort on whatever measure of volatility we choose AND/OR if a 52 week high/low is also reached then choose that stock for the basket.

Charlton
 
I assume you are talking about daytrading.

Possible RS measures:

Rate of Change - simple

possibly further refine with rate of change over multiple periods

or possibly further refine by sort on descending sharpe ratio to get trending stocks with smaller pullbacks

or possibly sort by ascending fractal dimension - again smaller pullbacks.

I have thought (but done no testing) that rate of change since the previous index high / low over whatever timeframe you wish, might be a good idea.
 
Last edited:
I seem to recall that the comparative relative strength was a very simple calculation
price of stock divided by price of $INDU - could be expressed as a percentage. Thus $INDU will always be 1 or 100%. However to make it equivalent to what we do in N min change we might also be interest in a movement over a period. So we would look at whether the stocks price had moved more or less than $INDU within a period.

Charlton,

I'm working on something similar to what you just described above. I've been trying to build an indicator to save you guys the trouble as you're doing so much work. I'm coding in TS2ki and as you're aware i'm finding the global variable bit difficult.

The indicator will calculate a stocks rate of return compared to INDU, or a stocks Volatility Ratio(VR) compared to INDU. It's part of the formula when calculating a stocks standard beta. Relative strength/weakness of a stock for our purposes can be calculated as follows:

1min Stock %change / 1min INDU %change = VR

We can then convert that into a 14 period average like N min, or 14 AVR if you like.

AVR Over 1 = stock strength compared to INDU
AVR Below 1 = stock weakness compared to INDU

The only problem is how will TS handle the positive and negative percentage change combinations when calculating the ratio? Will it do that automatically or do we have to put certain math rules in place so that we don't end up with negative ratio's? E.g

Stock %change = 1.2%
INDU %chnage = -0.6%

1.2 / -0.6 = -2

We are obviously looking for a value of 3 as the stock is clearly stronger than INDU. Simple math formulas will correct this if we do puruse this option.

Naeem
 
Last edited:
Charlton,

I'm working on something similar to what you just described above. I've been trying to build an indicator to save you guys the trouble as you're doing so much work. I'm coding in TS2ki and as you're aware i'm finding the global variable bit difficult.

The indicator will calculate a stocks rate of return compared to INDU, or a stocks Volatility Ratio(VR) compared to INDU. It's part of the formula when calculating a stocks standard beta. Relative strength/weakness of a stock for our purposes can be calculated as follows:

1min Stock %change / 1min INDU %change = VR

We can then convert that into a 14 period average like N min, or 14 AVR if you like.

AVR Over 1 = stock strength compared to INDU
AVR Below 1 = stock weakness compared to INDU

The only problem is how will TS handle the positive and negative percentage change combinations when calculating the ratio? Will it do that automatically or do we have to put certain math rules in place so that we don't end up with negative ratio's? E.g

Stock %change = 1.2%
INDU %chnage = -0.6%

1.2 / -0.6 = -2

We are obviously looking for a value of 3 as the stock is clearly stronger than INDU. Simple math formulas will correct this if we do puruse this option.

Naeem

Naeem

Let's get your global variable problem sorted first. I have PMd you with a simple test to try to get GV sorted and then once that is done you can make the indicator more complicated. The simple test is to ensure that you can reference one row ($INDU) in other rows on radar screen.

Charlton
 
Good luck with your coding Naeem. (y)

Global Variables are tricky at first but once you crack it - you'll have 1000's of them !!

As for negatives, if they only occur when the stock or index is moving down - it's fine.

Nothing wrong with having a strong stock being +2% and a weak one being -2%. In fact - it's perfect for us.

I think we'll need to play with the periods. I know that N Min Change looks at ATRs for the whole day but I'm not sure if that is better or not. Anyway, if you do want to do a full day, you can do the following :

Inputs : MarketOpen(0930);
MinsSinceOpen = TimetoMinutes(time) - TimetoMinutes(MarketOpen);
RelativeStrength = average(NaeemsIndicator),MinsSinceOpen);

Cheers

Pete
 
Regarding how far to look back in selecting Strong/Weak stocks.

If only the 1 minute timeframe is used, then the indicator will only look back 14 minutes. However, is this such a bad thing ? The data is more recent when compared to INDU than if you look all the way back to the Open. A stock may be generally strong for most of the session, but later in the day it can become weak and this would not show up so well when looking at the whole day, whereas by only looking at the last 14 mins it seems that identified strong stocks are strong currently, which would seem more useful for scalping.
I accept that this goes against what Grey1 has recommended, but for scalping it might be worth trying in comparison to looking at the whole session.

Regarding the variable data compression.

I think that there is way to simulate altering the Data Compression in flight. The code would have to look backwards by aggregating previous 1-min bars.
Example:-

Data Compression = 1 minute.
Code puts the last 14 bars into 14 variables. The calculation (Comparative RS or whatever) can look at the 14 variables and do it's stuff.
That's the easy one.

Data compression = 2 mins
Code looks at the last 28 bars in pairs.
For each pair the code converts the data to one bar equivalent, with a H,L C and O, and puts the results into the 14 variables.
The code then has 14 x 2-min bars of data to work on in the same way as above.

Data compression - 24 mins
Code looks at the last 336 bars in groups of 24 and converts the data into 14 one-bar equivalents as above. etc etc.

I'm sure this is doable using a Loop method with variable counts. The question is whether the amount of processing to be done each time the compression changes is within the power of the PC.

Glenn
 
Hi all,

In case it is of interest or use to anybody here (aside fom work on real time analysis of the relative strength of stocks) please see below a couple of comments that have been made by Grey1 in the past on these boards:-

1) Stocks that have gapped up the most and stayed in positive territory are LONG candidates (reverse for short).
2) Stocks that stay positive when market oscillates into negative before moving back to positive are LONG candidates (reverse for short).

Cheers
Steve
 
If only the 1 minute timeframe is used, then the indicator will only look back 14 minutes. However, is this such a bad thing ? The data is more recent when compared to INDU than if you look all the way back to the Open

Glenn,

I also thought exactly the same as this and emailed Iraj a while ago. One of the issues being that the afternoon session can often be like an entirely new trading day. For scalping I think what you suggest may well work.


Paul
 
Glenn,

I also thought exactly the same as this and emailed Iraj a while ago. One of the issues being that the afternoon session can often be like an entirely new trading day. For scalping I think what you suggest may well work.


Paul

for scalping the 1 min is more appropriate,, The final program trade must consist of 2 modules TREND and OSC

TREND will catch the longer moves hence the ALL DAY DATA COMPRESSION
OSC will catch the most recent weakness or strength hence the 1 min time frame.

Trend does not have to have a perfect entry but good exit ,,
OSC must have perfect entry

Trend pos size must be small
OSC pos size must be larger pos size ( to take advantage of small moves )

Trend has low hit rate
OSC has high hit rate

Trend does not look into most recent data
OSC looks into most recent data (hence the 1 min )

Trend's stop looks into all day volatility envelope
OSC looks into most recent volatility


Hope this helps


grey1
 
I consider that for strong/weak stocks selection it is better to use not fixed quantity of bars, but the value defined by INDU characteristics - time which has passed from last local maximum/minimum INDU.

To find local maximum/minimum it is possible in the next ways:

1. Using oscillator on the following algorithm:
We define overbought/oversold levels. They should be slightly less, than the levels used for generation of trading signals. For example, for MACCI they are OB=80, OS =-80.
a) Oscillator shows OB, then leaves OB zone on bar Bar1.
b) Oscillator comes into OS zone.
c) After a while oscillator comes into OB zone.
d) We search for minimum INDU from Bar1 to last bar. It is a local minimum (Swing Low). If on this period there are some bars with identical low prices, choose the last one.
Similarly for a local maximum.

2. Swings INDU are defined by Zigzag method, if INDU changes more than minimum, defined in % or in terms of ATR.

The stock is strong if it shows strong growth on up swing INDU (from local minimum INDU to local maximum INDU) and the minimum falling or even some growth on down swing INDU.
 
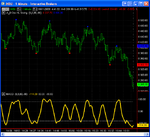
Local maxima (blue points) / local minima (red points) defined by MACCI.

attachment.php
 

Attachments

  • Osc HL Swing.png
    Osc HL Swing.png
    26.9 KB · Views: 111
Top