Wot Happens Next (2)

barjon

Legendary member
Messages
10,752
Likes
1,863
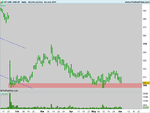
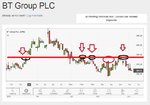
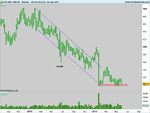
Ok here's another. It's BT which is at or approaching a possible floor (or not) to an eighteen month decline. In the face of market strength latterly, too.

At an opportunity level? If so, how might you use TA to trade it?
 

Attachments

  • BT GRP. ORD 5P.pngW.png
    BT GRP. ORD 5P.pngW.png
    23.7 KB · Views: 372
  • BT GRP. ORD 5P.pngD.png
    BT GRP. ORD 5P.pngD.png
    19.4 KB · Views: 377
As barjon has previously made it clear what this thread is about, then can all contributors please keep posts relevant to the thread as any that are "off topic" will be deleted.
 
This stock is not responding to the rest of the bullish indices , it is closing lower at above support.Underlying strength of this instrument is weak , compared to rest of the market .I may become a buyer above 3.40 , after 2 sets of resistances are broken.I would want to see a clear up channel on weeklies and test and retest of 3.40 as a support.

I would become a seller below this 300 level , after a test and retest of this level , in other words it is most likely to become a resistance in any correction.I view this stock as a sell rather than a buy.

This is my reading of this road map of B T.:)
 

Attachments

  • ha ha ha.jpg
    ha ha ha.jpg
    95.6 KB · Views: 339
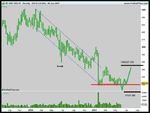
Based purely on TA off two charts without looking at anything else, this is probably a long bet for me with a SL below 2.97 in case it makes a LLow.

Limit Long Entry @ 311, SL @ 296, target 370s.

I'd be looking to take half position off around 340 and leave the remaining 50% to run.

(y)
 
My TA tells me it isn't going up and it isn't going down. So I have to stay in cash on this one. But I look forward to being told I'm wrong.......
 
My TA tells me its in a clear downtrend (on weekly), marked by successive lower lows and lower highs. Its also below the cloud (Ichimoku)
Point and figure has a bearish price objective of 206
I'd trade the breakout on a weekly close below 296
 
Ok here's another. It's BT which is at or approaching a possible floor (or not) to an eighteen month decline. In the face of market strength latterly, too.

At an opportunity level? If so, how might you use TA to trade it?

It's time for a bounce to 340 ish maybe. Higher anyways.Been going down way too long, oversold. my best guess.

Let us know how it does
 
I'm Bullish but think there maybe a spike below 300, so i'm long on a retest of 300, Stop 280 and Target 350
 

Attachments

  • BT.png
    BT.png
    35.1 KB · Views: 334
My two pennyworth.

Whilst BT is weak I don't want to fight the market while it is trading strongly so I'm only interested in looking long here unless that changes.

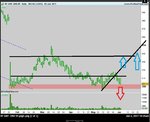
If price starts moving up then the two dashed yellow levels interest me. I will try a half tester as (if) the first one goes around 312 with a stop around 302. Don't want to risk more than £100 so that gives a £10pp position. Will add if second goes and adjust stop to ensure no overall loss.

If price starts moving down or faffing about I'll assume 300 will be a bit of a pull and I'll wait for it to bounce back out of the pink rectangle and buy at around 303/4 with stop at 296.
 

Attachments

  • BT GRP. ORD 5P.pngTRADE.png
    BT GRP. ORD 5P.pngTRADE.png
    19.1 KB · Views: 351
My two pennyworth.

Whilst BT is weak I don't want to fight the market while it is trading strongly so I'm only interested in looking long here unless that changes.

If price starts moving up then the two dashed yellow levels interest me. I will try a half tester as (if) the first one goes around 312 with a stop around 302. Don't want to risk more than £100 so that gives a £10pp position. Will add if second goes and adjust stop to ensure no overall loss.

If price starts moving down or faffing about I'll assume 300 will be a bit of a pull and I'll wait for it to bounce back out of the pink rectangle and buy at around 303/4 with stop at 296.

Is the math right here Jon? Does BT only move in £1.00 jumps?
 
Ok here's another. It's BT which is at or approaching a possible floor (or not) to an eighteen month decline. In the face of market strength latterly, too.

At an opportunity level? If so, how might you use TA to trade it?

Actually, this looks like the stock may do the opposite of the general market - ie when it turns up it may well correspond with the general market turning over to the downside.

It is difficult to use pure TA when there is volume available to give big clues as to what is most likely to happen.

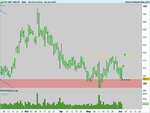
We had the chance to buy up from 315 (4 bars back) but we dropped back with no buying power. Then, we finally have 3 bars of bottom pickers - each time being met by some entity selling into the buying, resulting in an inability to hold the highs each time.

Split the order into 2 units - 1st sell unit 305 and 2nd unit 309, with a stop at 320 and a limit target at 290.

Then would look to get long if we get decent volume definition in the 280 zone, with a target back up to 330.

So I guess I am using TA on volume DNA rather than a price pattern as such. Sorry if that is slightly off topic regarding the thread.
 
Volume is an important part of technical analysis. Whether or not the demand that appeared in the middle of May will last remains to be seen, but buying this retracement is a low-risk option. If price doesn't rally, the trade is never triggered.
 
My road map , that is technical anylysis says 5 tops resistance on the dailes.That is heavy resistance .I would not buy it in a million years.

I think I need patience to wait for a few months to see a better opportunity.
 

Attachments

  • quadruple top.jpg
    quadruple top.jpg
    93 KB · Views: 335
Actually, this looks like the stock may do the opposite of the general market - ie when it turns up it may well correspond with the general market turning over to the downside.

It is difficult to use pure TA when there is volume available to give big clues as to what is most likely to happen.

We had the chance to buy up from 315 (4 bars back) but we dropped back with no buying power. Then, we finally have 3 bars of bottom pickers - each time being met by some entity selling into the buying, resulting in an inability to hold the highs each time.

Split the order into 2 units - 1st sell unit 305 and 2nd unit 309, with a stop at 320 and a limit target at 290.

Then would look to get long if we get decent volume definition in the 280 zone, with a target back up to 330.

So I guess I am using TA on volume DNA rather than a price pattern as such. Sorry if that is slightly off topic regarding the thread.


Interesting perspective thanks for this. (y)

I thought of something similar to trade the consolidation placing shorts and longs in the tighter range but overall the greater probability seems to be support holding around 297-300 having been tested twice.

On balance, based on pure TA thought a fib retrace is due as markets often over-react. :rolleyes:
 
Volume is an important part of technical analysis. Whether or not the demand that appeared in the middle of May will last remains to be seen, but buying this retracement is a low-risk option. If price doesn't rally, the trade is never triggered.

How do you use vol? I don't know how I never use it. In my experience vol spikes can occur right before an upswing, right before a downswing and more often than not in the middle of nowhere. IE, price continues higher or lower despite vol. Vol doesn't seem to matter.
 
How do you use vol? I don't know how I never use it. In my experience vol spikes can occur right before an upswing, right before a downswing and more often than not in the middle of nowhere. IE, price continues higher or lower despite vol. Vol doesn't seem to matter.

Can you show some examples of this? (the bold underlined section) to show that there is a higher probability of a continuation rather than say reversing after a volume spike?

Your last 2 sentences:

Is it the fact that price doesn't matter or volume? See, its interesting from the perspective you view it. Volume is a complex area, and means nothing without context and relationship. Spikes are a small part of it, and too much is made of this one aspect.

You dont need volume to trade, but it can add more information if you do get a decent grasp of it. We trade the price, how we come to the decision is up to the individual.

Anyway thats for another thread, Barjon has stated the idea is to use TA as a tool and see what we can get from it. Lets see where BT goes in the next few weeks.

Why you're underlining that part of my post I don't know. I think my point is players come in and out at many price points, for many many reasons, vol is useless in any prediction of future price.

The way you and other guy makes it sound like you can pick turning points off vol. That's not my experience.

Hell, I've seen price move on almost no vol, what do you think about that ;)

It was only underlined only to see if there is any value in spotting a volume spike- but like you said, it can occur left, right and centre.

No, this is not easy, not at all, very complex, I dont know anyone whom says otherwise. Picking turning points? What degree of accuracy would be needed to show it had any value?

Price moving on nearly no volume = time of day/delayed volume reporting etc. Moving price to action areas with little effort. The key is to look for "out of place volume" in relation to the average "norm". But the volume has to be related to opportunity. So low volume does not really mean much without a relationship.

After all you dont want to stand in the middle of the field when there is no one there to pitch to you:cheesy:

The post was not to suggest this is easy, far from it, sorry if it came across that way?

This is off topic to the thread, so my last post on this. BT only from now on!
 
Top