All you need is... a chart

firewalker99

Legendary member
Messages
6,655
Likes
612
In this thread I'll discuss why traders don't need to study anything other than a chart. I will show you that every news item, corporate report, monetary decision, in short anything fundamentally related to the economic situation of a stock or market, is printed on the chart first, long before the public becomes aware of it.

The tape tells the news minutes, hours and days before the news tickers, or newspapers, and before it can become gossip. Everything from a foreign war to the passing of a dividend; from a Supeme Court decision to the ravages of the boll-weevil* is reflected primarily on the tape. -- Richard Wyckoff

Undoubtedly people will tell me this can't be true, otherwise why would we have market analysts? Why would the newspapers print financial pages? The purpose of this thread is to inform, not to convince any disbelievers. All you need, is painted in the chart. Several concrete examples will be shown to support my case. The topic is open for discussion, but I hope this thread can become more than an evocation of "this is my opinion" posts. If you feel strongly about something, back up your point of view with some arguments.

Here's to the wonders of the chart :)
 
I suspect that you will show that in many cases the information is in the chart before the news even comes out. What may also be shown is some cases where the information was not in the chart before the news was available.

In those cases, to me, the question that tests your argument would be: without being an insider, was it possible to have fundamental information that would guide a better trade before the chart showed the impact of the news?
 
Good news... bad news...

Some traders are very anxious on the lookout of news, be it earnings season, rate cuts, important economic indicators, non-farm employment...

Before we talk illustrate the affect news can have on the market, we'll enumerate the four different possibilities:

(1) Good news comes out but the market fails to go higher: consider this to be warning signal.

(2) Good news comes out and the market rallies: could be positive, but buying on good news is often a risky thing to do, because smart money will try to unload when the public is buying in a frenzy.

(3) Bad news comes out, the market plunges: this often leads to a short lived down move. The public dumps the stock and believes the state of the business (or the economy in general) is getting increasingly worse. Smart money can easily pick up shares at low prices without driving price higher.

(4) Bad news comes out, the market doesn't drop: consider this to be a sign of strength. If the market fails to go lower on bad news, it means the worst is usually over and the news has already been fully discounted in the prices of shares.
 
this thread sounds interesting,keep it up.
about my only experience with news trading is a quick look at oandas news efects!(y)
 
I didn't expect to see reaction to quickly already!

I suspect that you will show that in many cases the information is in the chart before the news even comes out. What may also be shown is some cases where the information was not in the chart before the news was available.

You are free to provide some charts to illustrate what you mean. However, despite the fact that there may be a "surprise drop in earnings" or "an unexpected rate cut", I'll illustrate that the news will only have a temporary effect on the markets. It's important to be aware of some major news releases, but you don't need to know or understand the economic fundamentals behind the news to understand the markets.

In those cases, to me, the question that tests your argument would be: without being an insider, was it possible to have fundamental information that would guide a better trade before the chart showed the impact of the news?

If you're an insider and you are selling shares before bad news is released, you are in effect creating the pattern that leads to a drop in prices. The chart shows not only the impact of the news, but also gives clues about the future direction. It frequently gives warning signals to the extent that the closely observing speculator is aware of what might happen, before it happens.

I think this is in general true. The challenge is how to profit from it. In other words, it can be true but not very useful.

How to profit from it, is another matter. Let's not get ahead of ourselves :)
 
Some traders are very anxious on the lookout of news, be it earnings season, rate cuts, important economic indicators, non-farm employment...

Before we talk illustrate the affect news can have on the market, we'll enumerate the four different possibilities:

(1) Good news comes out but the market fails to go higher: consider this to be warning signal.

(2) Good news comes out and the market rallies: could be positive, but buying on good news is often a risky thing to do, because smart money will try to unload when the public is buying in a frenzy.

(3) Bad news comes out, the market plunges: this often leads to a short lived down move. The public dumps the stock and believes the state of the business (or the economy in general) is getting increasingly worse. Smart money can easily pick up shares at low prices without driving price higher.

(4) Bad news comes out, the market doesn't drop: consider this to be a sign of strength. If the market fails to go lower on bad news, it means the worst is usually over and the news has already been fully discounted in the prices of shares.

good luck with this thread. being an intra-day player, sharp news-based moves affect me.
Knowing how I can tell whats going to happen from the chart would add to my skills.

However, the 4 scenarios you painted are all AFTER the event, ie, what you can discern from a reaction to news.

Look forward to some examples of knowing the direction before a news-event.
In fact, this can be done real-time, cant it? :innocent:
 
Good news... bad news... the timing

In post #4 I talked about the potential effects of news on price behaviour. There is one important element still missing from this analysis and that is "time".

Good news is omnipresent near the end of the bull market phase, usually characterized by a parabolic rise in price. This is one of the rare occasions that buying on good news might lead to profits, because price tends to continue in that direction in this phase of the market cycle.

Bad news, and "catastrophic news" comes out near bottoms. Selling on bad news usually means you'll be selling too late. This is not to say that prices can't go lower, but when bad news is released, the market already knows about it.

Therefore the first important rule here, if you want to play it safe, is to avoid trading the news. There are too many variables in play to determine what will happen seconds before the report or on the moment of the release itself. However, if you're in a position already, I'll show you there are a number of elements that have a high probability of assessing the initial reaction of the market.

The second rule is to pay attention to the reaction to the news and play that reaction technically, with complete disregard to the economical indicator, be it better or worse than forecast.
 
Last edited:
Example 1: news reversals

The purpose of this thread is to discuss theoretical concepts, but to illustrate with practical examples too.

The first example serves to show that the market often tricks the public into buying on good news. Unless a technically important level (like support or resistance) is breached, the market often returns to it's previous trading level after the news. I know of traders who specialize in trading these 'news reversals'. The important however, is determining the odds that price will not reverse.

The third rule I suggest is that you scale out or exit your position if price moves in the desired direction on news. Scaling out gives you the opportunity to lock in profits quickly in case the news turns out to create a sharp spike. By leaving a part of your position open, you open yourself to the possibility that price continues even further.

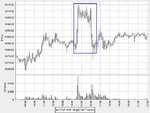
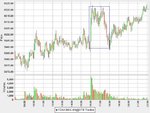
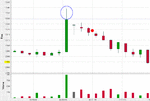
The attached charts all illustrate this concept. The huge volume peak is where the news came out. Notice how in each DAX chart price returns to it's previous trading level and continues as if nothing was going on. I'll provide more recent charts in the following charts.
 

Attachments

  • 20060901.jpg
    20060901.jpg
    54.2 KB · Views: 344
  • daxnews2609.jpg
    daxnews2609.jpg
    62.8 KB · Views: 310
Last edited:
I buy Company X as at Y date on the close. The next day the stock goes X dividend and price drops by the requisite amount. The information was not in the chart that it would do that ,it was in knowing that the company was going ex div the next day and you could expect the price to drop.Ergo ,all you needed was not in the chart.
 
fw, your charts show minor consolidation and bull flags, both likely set ups for resting Buy Stops orders to the long side with a reversal when new Highs failed to follow through.
I have no doubt the News was what influenced PA, but still maintain that the chart gave a heads up anyway

(not arguing with you, in fact I'm trying to say I agree with you....)
 
LOL...albeit I expect you should be able to find charts where a price pattern absorbed the price reaction to an ex div event ;) ..in other words at least some of the time you would have an expectation built into the chart action leading up to the event.
 
Look forward to some examples of knowing the direction before a news-event.
In fact, this can be done real-time, cant it? :innocent:

If you're talking about news reports or sentiment in general, yes. For example, price was distributing on the major US Indices near the end of last year and made a lower high before the whole subprime crises became in the popular media and before all the financial institutions were screaming for more liquidity from the FED.

As for singular news-events, it's not always that clear. In part because of the manipulation that it possible on smaller timeframes, and in part because so many people focus on trading around these reports. This can create some whippy action that catches both sides out.

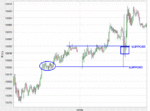
Attached is a chart of an important news report (FOMC if I remember correctly). Notice how 'technical' price reacts. Yes, anyone trading this would need very wide stops, but in the first spike price bounces back higher off the lower support area. And in the 30 minutes after the initial release, all price bars (5-min chart) continue to close above support, indicating where the buying pressure is to be found.
 

Attachments

  • ym20070509.GIF
    ym20070509.GIF
    26.2 KB · Views: 325
I buy Company X as at Y date on the close. The next day the stock goes X dividend and price drops by the requisite amount. The information was not in the chart that it would do that ,it was in knowing that the company was going ex div the next day and you could expect the price to drop.Ergo ,all you needed was not in the chart.

Gaps that appear due to a stock going ex-dividend have no trend implications. They are created not by a change in the supply-demand (which determines the trend), but by a sudden and irreversible alteration in the present value of the issue.

In post #7, I also mentioned that there's always the possibility that a surprise event (take an extreme example like 9/11) affects price in an unprecedented way and unaccounted for. But anyone remember what happened after that? Price returned right back the the same level it was trading before.

When a stock goes ex-dividend this might not be the case. But the ex-dividend doesn't change the pattern. You might want to adjust the new price level on the chart so that the stock will show the same relative position as before. Your point is obviously a valid one, but these fluctuations are inherent to the instrument. If a stock is going to be split in three, the chart's scale need to be adjusted too.
If the market has a limit down 5% per day, than it will probably benefit you from knowing this information too. So, "all you need is a chart" ...and the specifics of the instrument you're trading :)
 
Live example Today 1400 GMT

Within a couple of minutes we have the 'ISM Non-Manufacturing Composite' number which will have a definite affect on the markets. By determining beforehand what action is possible and where this action takes place, we can position ourselves better.

Now, there's not much time left (7 minutes) but I'm typing this as we go along.
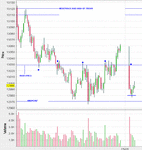
Attached is a DOW futures chart, with important support and resistance levels drawn on the chart. I have 13030 and 12930 as resistance and support, the midpoint is 12980, which is often an important area where price returns to, when trying to find value.

Notice how on Friday price went slightly below 12970 but kept very much around the 80 level. Also today, since the open we moved lower and touched 12977 before going up again slightly. A long entry would be fairly aggressive there, but it's possible...

Now, what do we look for?

(a) if the news is bad, we'd expect price to go lower, but we'd like to see buying come in around the potential support at 12970. Going long immediately would therefore be risky, but if we get confirmation that price is holding support (for example by first spiking through it but then closing all the way up again above support), this could trigger a buy signal.

(b) if the news is bad and 12970 is broken straight away, we stand aside and wait for price to find support lower (preferably around 12920-12930)

(c) if we move up on the news than we missed our entry, but too bad. Then we wait and see how price reacts to resistance at 13030 and see if we get a short signal.
 

Attachments

  • ym_20080505.GIF
    ym_20080505.GIF
    42.5 KB · Views: 273
(c) if we move up on the news than we missed our entry, but too bad. Then we wait and see how price reacts to resistance at 13030 and see if we get a short signal.

The ISM number was 52, better than forecast. So we spike up... but, this is a spike into resistance. Now, like I said we wait to see what the reaction to 13030 is. However, by waiting I don't mean minutes, because by then the chance to get in early will have passed. That's why I attached a blow-up of the action, a 15-second chart. Notice how the bar closes at 13029. Coincidence? Of course not. This is where selling pressure comes in.

If you look at this from a 1-minute bar or 5-minute it's still easy to see that price fails at this level. Although, the longer you wait the less obvious it's going to be that a nice short entry presented itself, with a stop around 13040 or so.

Now, forget about the news for a minute and just observe. How does it help you knowing that there was news and what the figure was? It doesn't. The fourth rule therefore is that you don't need to know what moves the markets, you only need to see the resulting action. Whatever the cause, price is being pushed down because there's a lot of supply at that level. The volume is huge, price fails, what more do you need to know? This doesn't automatically mean price will plunge, but at least you have a trade that you can ride back to the opening low, where you should expect price to find support again.

This example is meant to illustrate that the cause of what happens is irrelevant. Even if this would turn out to be a losing trade, it doesn't change the fact that you can see everything you need from the chart, without looking at the news.
 

Attachments

  • ym_20080505_ISM_15sec.GIF
    ym_20080505_ISM_15sec.GIF
    30.2 KB · Views: 212
Last edited:
Within a couple of minutes we have the 'ISM Non-Manufacturing Composite' number which will have a definite affect on the markets. By determining beforehand what action is possible and where this action takes place, we can position ourselves better.

Now, there's not much time left (7 minutes) but I'm typing this as we go along.
Attached is a DOW futures chart, with important support and resistance levels drawn on the chart. I have 13030 and 12930 as resistance and support, the midpoint is 12980, which is often an important area where price returns to, when trying to find value.

Notice how on Friday price went slightly below 12970 but kept very much around the 80 level. Also today, since the open we moved lower and touched 12977 before going up again slightly. A long entry would be fairly aggressive there, but it's possible...

Now, what do we look for?

(a) if the news is bad, we'd expect price to go lower, but we'd like to see buying come in around the potential support at 12970. Going long immediately would therefore be risky, but if we get confirmation that price is holding support (for example by first spiking through it but then closing all the way up again above support), this could trigger a buy signal.

(b) if the news is bad and 12970 is broken straight away, we stand aside and wait for price to find support lower (preferably around 12920-12930)

(c) if we move up on the news than we missed our entry, but too bad. Then we wait and see how price reacts to resistance at 13030 and see if we get a short signal.
=======================================================================

as could be seen from yesterday and todays price action, the prices were moving UP -- in more than one way suggesting the immediate reaction to the news would be a SHORT.

the very last seconds, and with the release of the news, the price drives UP to the H4 resistance point, finishing the runup brought about for the past two days, and the SHORT is now there to be played !

after that, the retrace and ability to play the long side --- 5458 looks good for EURUSD if it gets past 5452 and for the downside, 1.5357 is highly likely. Then we watch for the upside move later this afternoon !

unless one is faced with multiple news releases that affect the different currency pairs (although lately the USD is really the one being watched) the PRIOR price movements will tell you where the price is going !

mp
 
Last edited:
This doesn't automatically mean price will plunge, but at least you have a trade that you can ride back to the opening low, where you should expect price to find support again.

Price is now at 12980, back at the opening low. We don't know what will happen, will price break support, reverse and turn higher? Or consolidate here for a while before making a decision? Either way, depending on the personal style of the trader, he could take off some of his position (bag at least 40 points profit), move his stop to breakeven on the other half and see what happens. Or quit for the day.

as could be seen from yesterday and todays price action, the prices were moving UP -- in more than one way suggesting the immediate reaction to the news would be a SHORT.
The action of the previous day (Friday in this case) is always related to the action of the present day, but it's more important to see where price is (close to support or resistance) when waiting for some news report to come out. Yes, prices were driven higher on Friday, but they opened about 100 points below Friday's high. Based on that alone, I don't see any immediate relationship to assume that shorting the news would be the best thing to do.

after that, the retrace and ability to play the long side --- 5458 looks good for EURUSD if it gets past 5452
I think you're talking about another market... in these examples we only focus on the chart at hand. What happens in another market, in another chart doesn't affect our position. There's obviously some sort of correlation between markets, but that's topic for another - perhaps equally interesting - discussion.

unless one is faced with multiple news releases that affect the different currency pairs (although lately the USD is really the one being watched) the PRIOR price movements will tell you where the price is going !
mp

What happens before the news, isn't always easy to understand. Traders will often try to position themselves before a major release, therefore creating spikes that happen before the actual release. The "prior price movement" you're talking about doesn't always give away all the answers. For example, price could be making higher highs and higher lows all day, until it abruptly stops doing so caused by news...

Anyway, the main point that I'm trying to bring over here, is that the fundamentals are all in the chart. Once more, today, the news was good and sucked in the public thinking prices would go higher. All those who bought on the news will now have been stopped out.
 
Top