Best Thread Support & Resistance Explained

DionysusToast

Legendary member
Messages
5,965
Likes
1,501
But not by me, of course.

I would like to discuss support & resistance. I would also like for us all to keep an open mind and I promise to do the same.

The specific thing I would like to discuss about support & resistance is WHY it works when it works. I guess we could also discuss WHY it doesn't work when it fails.

Now - I have seen support & resistance work and fail on the e-mini S&P. When S&R works in the short term, my theory is that it is the target for a lot of the traders that entered below resistance or above support. They may have got in 6 points below resistance and have exit orders at or prior to that point. The selling at resistance is as likely to be longs exiting as much as shorts entering.

As it price hits reistance, the ask usually thickens up and when that is not fake, the logical thing to do for any short term trader is to now attempt a run to the opposite side. When the ask is fake, then the likeliness is that price will move through the resistance by 4 ticks or so at which points the fakers are finished.

In terms of short term support & resistance on the e-mini. 99.999% of participants are aware of the concepts of support & resistance. There is not a significant number of players unaware of the concepts of S&R who suddenly see 'value' at the support point and get back in long again.

As for things that can make S&R fail in the short term on the S&P. As has been discussed, flippers faking strength/weakness can sucker people in to thinking S or R is working & then blow through it. There is also the underlying markets. The S&P is merely a derivative of the underlying market and so excitement in one sector or the overall market may prevent e-mini traders' selling at resistance having much impact. If the stock markets are rising, then program trading will come in and buy the futures if they pullback significantly. So we have both intentional S&R failure based on e-mini traders and unavoidable S&R failure based on a major market move.

This is one case and one timeframe. First of all -feel free to critique my opinion on short term S&P moves. Secondly - feel free to pick a timeframe/market and explain the possible dynamics behind S&R working and/or failing.

DT
 
re: Support & Resistance Explained

Good start. Keep going.

S&R is the most important tool I use, interesting to have a good discussion about it.
 
re: Support & Resistance Explained

I typically scalp, looking for 5-8 ticks out of a trade and I use price action S&R quite alot.

While I don't use a market profile graphic to trade-off, I do like the concept from MP whereby if a buyer/seller has both the initiative and the strength to push prices beyond an established value area/range, then there is usually an opportunity to trade in the direction of the initiative activity, because there is a good chance the initiator will look to "defend" that break...

In terms of the logic in the underlying market - if you had size to sell, and could not find a block buyer (ie it was clear that the mkts perception of value had changed) then you had no choice but to start selling in the market until you found a new price where there was liquidity. When you found this point and were able to deal some volume there, you would help set a lower VWAP for your order and those of other market participants, hence as long market perceptions hadn't changed, an attempted rally, was a GREAT selling opportunity (ie support becomes resistance)

The corollory of this is a failed break, or level that is defended, where you as a seller pushed prices below a reference point to test the market and met a whole swag of responsive buyers looking to snaffle up some "cheap" stock, in which case you'd back off and let/incite competition among the buyers get the price back up.

either way, these points become the focus of activity and create potential opportunity's

That's one of the basic ways I think of S&R. That said, you can't ever know for sure what's going on in the underlying market, therefore alongside price action S&R, I'll also use other TA indicators such as Fibs and Pivots to back these S&R levels up, and always look at them in the context of trend. I figure that the more reasons you can find to trade a level, the better.
 
re: Support & Resistance Explained

But it don't work DT it don't work...!!!

Here is your chance to explain support & resistance on the timeframe/market of your choice.

Please take the floor. You obviously have some opinions on the matter. Why not share them ?
 
re: Support & Resistance Explained

Here is your chance to explain support & resistance on the timeframe/market of your choice.

Please take the floor. You obviously have some opinions on the matter. Why not share them ?

Welp its very simple really..and has been explained to you before...

But first if you could explain your starting post...you call it an explanation of S/R , but not by yourself, but by who then ?
 
re: Support & Resistance Explained

Welp its very simple really..and has been explained to you before...

But first if you could explain your starting post...you call it an explanation of S/R , but not by yourself, but by who then ?

Particularly since you have oft blathered on about how it does'nt work, is useless, and is a figment of traders imaginations....

So I'm wondering why the turnaround, if that is in fact what you post is...
 
re: Support & Resistance Explained

PS - if you want to turn this into a thread about me, do not expect me to help you in that endeavour.

You say this has been explained before and if so, feel free to cut & paste. Just pick a market and a timeframe if you can and explain the dynamics in play.

If you don't wish to contribute, that's fine. If you want to start a thread specifically to attack me, then please do that.

For now, I would like to keep this thread to discuss the specifics of support & resistance market by market.

So - one last time, I respectfully request that you contribute to the subject at hand.

Thank you.


So are you saying you now believe in S/R ?!
 
re: Support & Resistance Explained

Some reasons why support and resistance might hold or fail:

If it is forex, a country may want to support a particular level in the short term, because it is beneficial for the country. Perhaps the rate is just dropping too rapidly and they need to stabilise it. They only do this temporarily, so of course it will fail later on.

Lots of people love a bargain. So if they want to get long, they want to get long at a better price than just market. They look for a place to get long, and a nearby support level stands out. Cumulative effect of many people doing this. The same with those who were short and have targets as you mentioned. A cumulative effect, which then snowballs.

Support becoming resistance. Those who went long, see something they don't like, and now want out.

Manipulation. A big player(s) who is already short and wants to increase their position, may create the illusion of a double bottom only for it to fly straight through on the third time. This catches the stops of those who entered at the support level, and newcomers who were playing a triple bottom. But on the second time the level held (well as far as short term traders are concerned anyway). If you're big enough to push the market around temporarily, then you want to be getting out at best price. What is the best price? Where is the liquidity going to be located for you to do that?

Again a big player may just show strength at a particular level because it is simply easier for them to control other traders reactions that way. A support level is observed by the market. Price spikes through it, and is very quickly bought up. Now those who shorted on the breakout, want out (ideally near the support level) and will push it up, those who were short from before see it bouncing strongly at a support level and now want out (again ideally at the best price which is the support level), and others who see it holding will jump on long. That's a lot of people pushing it up in the vicinity of that support level, just because a big player defended the level for minutes.

Someone who wants to accumulate a large position, but at a specific average price. Buys at a level X but is not willing to buy at X+10. Waits for it to come back down, lets it go below X, buys some more, and will keep buying around that area or below until the position is built.
 
Last edited:
re: Support & Resistance Explained

I use a dynamic support and resistance method, there is no specific level and areas of support are in proximity of specific level.These approximate levels are adjusted for volatility increase /decrease and inter market behaviour.So support and resistance is dynamic and can not really be fixed.

Support and resistance levels are continuous changing levels, and I trade them with wider stops to allow for increased volatility.
 
re: Support & Resistance Explained

In terms of short term support & resistance on the e-mini. 99.999% of participants are aware of the concepts of support & resistance. There is not a significant number of players unaware of the concepts of S&R who suddenly see 'value' at the support point and get back in long again.

If that were true then something is wrong. Either some of those participants are unable to trade SR properly or it's far less than 99.99%.
SR is almost always spiked through to catch stops otherwise how would the "market" dominant order flow make money? That's a long worded way of saying if there are more longs in the market, they're going to spike the level to squeeze some of the shorts out.

An alternative view is that there are more technical analysts in the market than fundamental players and the TAers look at the levels more. Whilst I can understand how a level in the FX market plays an important SR point for commercial reasons, same in commodities, I cannot fathom how a level in stocks plays the same role as there is much more speculation. The old theory is that when everyone went long at 90, they remember the level in their head - I don't feel this is relevant in an age where charts dominate most people's screens so SR is therefore provided more by charts and psychological levels like fibs.
 
re: Support & Resistance Explained

I've come to the conclusion that S&R and Fib lines are of no more benefit to me than many other indicating lines, such as averages, etc. In fact, in my view, strongly trending averages give me a better idea of probabilities. People do place orders around S&R but, because the lines are so plentiful I shoukl say that, no matter where you put your order you'll be near one. I have seen spikes, time and time again, go though a large number of places that could be said to be support or resistance.

Sorry, fellas, but support and resistance is too general to be of much use. The charts are full of them.
 
re: Support & Resistance Explained

If that were true then something is wrong. Either some of those participants are unable to trade SR properly or it's far less than 99.99%.
SR is almost always spiked through to catch stops otherwise how would the "market" dominant order flow make money? That's a long worded way of saying if there are more longs in the market, they're going to spike the level to squeeze some of the shorts out.

When I say that 99.999% of the markets are aware of the concepts of S/R, it do not mean that they all trade based on it. Let's say for a second that the concept of S/R in stocks goes along the lines of 'price memory' in people's heads as you said. Perhaps Grandpa brought at 90 and sold at 150 and then when price gets back to 90, he buys again and hence, he and all others like him create the support point. My opinion, although without any evidence to back it up is that Grandpa is in the minority. That the amount of people trading stocks in this way as part of their buy & hold strategy are in the minority. My opinion is that there are more people that understand and look for areas of support than there are people who do not know about S/R and just have numbers in their heads.


An alternative view is that there are more technical analysts in the market than fundamental players and the TAers look at the levels more. Whilst I can understand how a level in the FX market plays an important SR point for commercial reasons, same in commodities, I cannot fathom how a level in stocks plays the same role as there is much more speculation. The old theory is that when everyone went long at 90, they remember the level in their head - I don't feel this is relevant in an age where charts dominate most people's screens so SR is therefore provided more by charts and psychological levels like fibs.

Of course, it could be that there are many more Grandpa's who trade based on price memory than there are people trading the level based on technical reasons. It is possible that those trading S/R technically on stocks are getting one over on those who are trading the level for other reasons. I just doubt this is the case.

I totally agree with you on the stocks issue - FX is a little more complex that commodities in my opinion. I would agree there is a case for commodity prices to reach equilibrium based on the price of the underlying but for sure in oil this does not seem to happen. It certainly appears that oil price is driven by speculation that by the supply & demand of the physical product.

FX is a different beast, whilst commodities futures are a speculative vehicle, the volume of FX trade that is down to non-speculative trades are massive. Forex is unique in that a huge percentage of transactions take place to facilitate trade. Another unique feature is that a lot of retail Forex trade doesn't even go close to the markets.

This is why in the OP, I wanted us to look at different markets and timeframes. I agree entirely about your stop running comments and you can see this every day in the ES. I can't see how a similar thing could happen in Forex long term.
 
re: Support & Resistance Explained

Initially, I wasn't sure about S&R and thought fibs were just crazy. Then someone explained the reason why they may possibly 'work'; it's because alot of other traders are using them and thinking the same. Im ALOT more skeptical on S&R, fibs when it comes to things such as FTSE etc than I am in Forex. I also wouldnt use fibs by themselves, they need to line up with S&R.

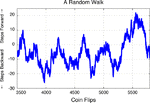
Attached is a random walk chart (coin flips). I can see S&R that would 'work' on there but its all just totally random....

Has S&R or fibs ever been statistically tested to see if the actually do 'work'?
 

Attachments

  • randomwalk_37230.gif
    randomwalk_37230.gif
    33.4 KB · Views: 431
re: Support & Resistance Explained

PS - if you want to turn this into a thread about me, do not expect me to help you in that endeavour.

You say this has been explained before and if so, feel free to cut & paste. Just pick a market and a timeframe if you can and explain the dynamics in play.

If you don't wish to contribute, that's fine. If you want to start a thread specifically to attack me, then please do that.

For now, I would like to keep this thread to discuss the specifics of support & resistance market by market.

So - one last time, I respectfully request that you contribute to the subject at hand.

Thank you.

As requested - from your Thread Wall St = Minus Sum Game Post 229 (just insert S/R for TA):

TA works because of the following reasons -
Charts are visual representations of traders / crowds / human psychology acting in the markets. Traders have memories, and so remember previous price levels where price stalled or where there was plenty of overhead supply or demand ie support / resistance etc.

TA reflects human and crowd behaviour

Self-fulfilling prophesy - if everyone is looking at the same thing on their charts eg a resistance level...and the chart indicates that price tend to stall or reverse at this level , then it is more likely that different traders will look to exit longs at this level, and / or there will be a lack of buyers at this level.....and this is where confluence also comes in - the more factors which indicate the same thing, the more traders will act on it, increasing the self-fulfilling aspect
 
re: Support & Resistance Explained

I agree entirely about your stop running comments and you can see this every day in the ES. I can't see how a similar thing could happen in Forex long term.

I do tend to see the same stop running in FX markets. Especially intraday, you can see cable burst through SR by about 10-20pips before reversing. Perhaps this is stop running, perhaps it is just stops being hit unintentionally at those levels causing the spike.

As an example, one of the theories is that all the trades that went short at a support zone, wait for price to return to that short zone and then close causing the support, eg
(a) Level 100, I go short at 100 but price moves to 110 then comes back to 100. When it reaches 100 I thank my lucky stars and close out the trade (closing a short = BUYing) voting never to go short at that level again. (b) More buyers come in at that level also because that's where they think the buyers are going to be waiting.
With (a) I find it hard to believe everyone would hold onto their short trade for that long.
In FX, there is the supply or demand issue. I would suspect companies are far more likely to pick round number levels for their trades or Daily SR levels but I have no evidence of that.
 
re: Support & Resistance Explained

The specific thing I would like to discuss about support & resistance is WHY it works when it works. I guess we could also discuss WHY it doesn't work when it fails.

I thought I would post a few things I've personally noticed about trading s/r across multiple markets.

Bear in mind that this applies to the D1 and H1 timeframe only. I'm not saying that s/r doesn't work on other timeframes I am saying that I do not usually watch any other timeframe so I can't comment on it with any accuracy.

As an intro I would say that if you think price reactions to s/r resembles a "random walk" then, with all due respect, you are drawing your s/r wrong.

Having said that, making money off of your s/r levels is not easy. That is because it takes a lot of time and experience to tell if it's going to be a very short term reaction or a longer term one and then of course if you can't differentiate between the two then all the problems of when to exit start to occur.

However, I would say that if you draw s/r levels on an D1 and H1 chart and you don't get a reaction (i.e. a counter trend reversal or a rapid decrease in momentum) to within a few pips, the vast majority of the time, you are definetly drawing your s/r wrong.

Here are some things that I have noticed to increase the probability of a tradable reaction. Note that what links almost all of these is the concept of time.

Time is of the utmost importance in the relationship of price and s/r.

1) Price is most likely to hold a level on the first touch. The second is usually pretty good too. When price is back for the third time I'm usually starting to get wary. After price has hit for three times relatively recently, it's probably best to forget about it. The probability of a level holding cleanly seems to diminish the more price has hit in a short span of time. If there is too much action around a level you will see it start to get abused and the sign of this will be price not reacting cleanly to it.

2) If the price has just bounced ahead of a the level the chance of it bouncing again if it comes straight back to it a short while later is dimished.

3) Price is more likely to reverse at a level if there has been some time and space beween the breakout point and the point at which is returns to it. I personally prefer to see what I call a rounded approach by price on the H1 or D1 timeframe to fulfil this criteria. What is rounded? Think of the letter U.

4) Price is more likely to bounce if it hits your level when price movement has well exceeded its 20 day ATR. This was a very popular technique with the scalpers in prop. You can also factor in time of day with this to increase probability. The nearer an active session close, the better for at least a short term reaction.

5) The majority of the time, if you hit a level before news, the news will go the way of the level if you have hit it right (with the above considerations in mind). This is why you can largely ignore the news and yes, this was one of the things that always amazed me the most when I was learning how to trade.

I'm not going to bother with examples of any of these points because hindsight is irrelevant. Just consider them and see for yourself.

Just my 2 cents.

Thanks Dion for a nice thread.
 
Last edited:
re: Support & Resistance Explained

4) Price is more likely to bounce if it hits your level when price movement has well exceeded its 20 day ATR. This was a very popular technique with the scalpers in prop. You can also factor in time of day with this to increase probability. The nearer an active session close, the better for at least a short term reaction.

5) The majority of the time, if you hit a level before news, the news will go the way of the level if you have hit it right (with the above considerations in mind). This is why you can largely ignore the news and yes, this was one of the things that always amazed me the most when I was learning how to trade.

I'm not going to bother with examples of any of these points because hindsight is irrelevant. Just consider them and see for yourself.

Just my 2 cents.

Thanks Dion for a nice thread.

4/ Definitely something to consider more for high probability trades.
5/ Do you mean that if the resistance level is 100, price reaches near 100 and pauses just before the news that you reckon price will push up through it and continue? I've seen just as many times big reversals at major news like NFP, GDP, unemployment, RPI, etc.
 
re: Support & Resistance Explained

5/ Do you mean that if the resistance level is 100, price reaches near 100 and pauses just before the news that you reckon price will push up through it and continue? I've seen just as many times big reversals at major news like NFP, GDP, unemployment, RPI, etc.

No, I mean that if the resistance level is 100, you sell it at 100 before the news and the majority of the time, it will reverse. I should add that if is a straight forward resistance level and not one that has alternated between support and resistance I would be less keen to use this. Levels that have been both s and r are way more reliable.
 
Top