Buy @ support, selling @ resistance, selling @ minor resistance, buy @ minor support

JTrader said:
Hi DBP

I may be wrong, but as I see it, the green dots form 5 pairs of dots - one upper and one lower dot in each pair for the first 4 pairs of dots. The fifth pair of green dots are the two dots to the far right.

Upon first sight, for going long, the chart didn't/doesn't look very appealing to me, due to each option being at or near a new LL.

However, upon close inspection -

Entering long at the close of the candle that the first lower green dot represents makes more sense than entering long at the close of the candle represented by the first upper green dot.
The preferred candle has closed by retracing back into a range, after breaking support/making a LL - showing signs of a retracement up/recovery/strength.
The upper first dots candle is one candle later, and has shown signs of weakness by closing below the previous candles close.
Therefore entering here not only gets you into the long trade later than the previous candle (missing out on some profits), but you're also buying into potential weakness.

For the second pair of green dots, entering at the close of the candle represented by the lower green dot again seems to make more sense.
The preferred candle again broke the previous support level and closed lower than its open. But after making that LL, price retraces sharply, evident through the long lower spike on the candle, closing within the range of the previous LL - showing signs of a retracement up/recovery/strength.
The candle represented by the 2nd upper green dot not only gets you into the long trade one candle later (when some of the potential profit has been missed), but this candle again shows signs of weakness by closing lower than its open, and lower than the close of the previous candle.

For the third pair of green dots, again going long at the close of the candle represented by the lower green dot seems to make more sense.
The preferred candle has made a new low, but it has closed within the range of the previous candle - showing signs of a retracement up/recovery/strength.
Whereas the candle that the 3rd upper green dot represents, one candle prior to this had made a new LL, showing significant weakness.

For the 4th pair of dots, buying at the close of the candle represented by the upper green dot makes more sense this time.
The candle prior to this one (represented by the 4th lower green dot) has again made a new LL. Although it has shown some signs of strength by closing 3 pips higher than it's low, it only closes at the same price as the previous LL.
The next (preferred) candle however, shows clearer signs of strength, continuing the retracement from the previous candles low, and closing within the range of the former LL.

With the fifth pair of green dots (two green dots furthest right), going long at the close of the candle represented by the furthermost right green dot seems to make the most sense.
This and the alternative candle (as i see it - represented by the green dot that is 2nd most right) both have seen price recover above 1.3000, following a very recent price fall below 1.3000.
However, the recovery of price above 1.3000 in the candle on the far right seems to take place easier, quicker and more convincingly (within one 10-tick candle as opposed to three 10-tick candles), thus showing greater strength and potential for a continued reversal up.

Buying into (signs of) strength seems to be the recurring theme, and buying into (signs of) strength does make more sense than buying into weakness, especially when looking for price to reverse.

Thanks again.

Set 1.30 aside for now. What does "8" represent?
 
dbphoenix said:
Set 1.30 aside for now. What does "8" represent?
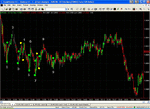
8 looks to represent a 3rd failed attempt to break through minor (or is it now becoming much more like major) R @ 1.3011-12.

Is there a name for a/the pattern that has been completed at 8?
 
JTrader said:
8 looks to represent a 3rd failed attempt to break through minor (or is it now becoming much more like major) R @ 1.3011-12.

Is there a name for a/the pattern that has been completed at 8?

As I said, set aside 1.30 for now. Forget about it. Focus on HLs, LLs, LHs, HHs.

Look at the yellow dots here:
 

Attachments

  • Image1.gif
    Image1.gif
    117.4 KB · Views: 327
From left to right -
Yellow dot 1 forms a LH
Yellow dot 2 forms a HL
Yellow dot 3 forms a LH
Yellow dot 4 forms a HL

Thanks again.
 
Last edited:
dbphoenix said:
So why not go long at the HL?

In real time I'd probably have been suspecting that price may continue down from the LH at the 1st yellow dot. Knowing where to pin the tail on the donkey so to speak (hopefully at the low of the HL).

To go long at the close of the candle marked by the 2nd yellow dot, especially when that candle closed down (red) may have added even more doubt as to whether this was the low within a HL.
 
From left to right -
Yellow dot 1 forms a LH
Yellow dot 2 forms a HL
Yellow dot 3 forms a LH
Yellow dot 4 forms a HL

Is it just a coincidence that 3/4 of these candles opened and closed at the same price, thus indicating unstable/spiky price action within these candles - perhaps due to price struggling between a continuation and a reversal??
Is this a phenomenon that you are aware of on candles that form LH, LL, HH, HL?

Thanks again.
 
JTrader said:
In real time I'd probably have been suspecting that price may continue down from the LH at the 1st yellow dot. Knowing where to pin the tail on the donkey so to speak (hopefully at the low of the HL).

To go long at the close of the candle marked by the 2nd yellow dot, especially when that candle closed down (red) may have added even more doubt as to whether this was the low within a HL.

Yes, price might continue downward, but you have no way of knowing that. But if you were to place a buy order above that candle rather than go long at the close of it, you wouldn't be stopped in if price continued its decline.

Let's say, however, that you do place a buystop above that candle, you get your HL, and you're stopped into a long. Where do you place your stop to cover?

Db
 
dbphoenix said:
Yes, price might continue downward, but you have no way of knowing that. But if you were to place a buy order above that candle rather than go long at the close of it, you wouldn't be stopped in if price continued its decline.

Let's say, however, that you do place a buystop above that candle, you get your HL, and you're stopped into a long. Where do you place your stop to cover?

Db

I would put my SL at the low of the preceeding candle (2nd yellow dot), or one pip below that candles low.
 
JTrader said:
Is it just a coincidence that 3/4 of these candles opened and closed at the same price, thus indicating unstable/spiky price action within these candles - perhaps due to price struggling between a continuation and a reversal??
Is this a phenomenon that you are aware of on candles that form LH, LL, HH, HL?

Thanks again.

You wouldn't know that in real time. However, you would know that the first rally drives back above the previous swing low (as does each subsequent rally in turn). This suggests a certain lack of enthusiasm on the part of sellers, or unusual determination on the part of buyers, either or both of which suggest an eventual move to the upside. But even if you want to go long, you still have to determine where to enter.

Db
 
JTrader said:
I would put my SL at the low of the preceeding candle (2nd yellow dot), or one pip below that candles low.

If you're buying this because it's a HL, placing your stop below the bottom of the candle would be inconsistent. It's not a HL until price gets past the previous swing high (the first yellow dot). If it doesn't, you're holding the bag. Rather than be a deer in headlights and hope for the best, get at least to BE.

Like Teresa Lo said to me many moons ago, if it doesn't go, you don't want to be there.

Db
 
But let's move on.

Focus on the swings.

3 is lower than 1, a LL.

Price rallies to the first yellow dot and creates a swing point. It then falls but stops short of 3, making a HL. It then resumes its advance, culminating in 4, which is higher than the last swing point, i.e., the first yellow dot, but only for the moment.

With me?

Now price resumes its decline and makes a LL at 5. It rallies to 6, but can't make it to 4, much less past it. This is all a straight shot using this bar interval. Price then resumes its decline yet again, to 7, making a LL.

Price then rallies once more, to the third yellow dot, but it doesn't make it to 6. It's a LH. It then falls back to the fourth yellow dot, well above the last swing low, and works itself into another rally, all the way to 8.

What's different about 8?
 
dbphoenix said:
If you're buying this because it's a HL, placing your stop below the bottom of the candle would be inconsistent. It's not a HL until price gets past the previous swing high (the first yellow dot). If it doesn't, you're holding the bag. Rather than be a deer in headlights and hope for the best, get at least to BE.

Like Teresa Lo said to me many moons ago, if it doesn't go, you don't want to be there.

Db

(See highlighted lines)I wasn't aware of this. But I'm slightly confused as you then wrote -

DBP -

Price rallies to the first yellow dot and creates a swing point. It then falls but stops short of 3, making a HL. It then resumes its advance, culminating in 4, which is higher than the last swing point, i.e., the first yellow dot, but only for the moment.

With me?

Now price resumes its decline and makes a LL at 5. It rallies to 6, but can't make it to 4, much less past it. This is all a straight shot using this bar interval. Price then resumes its decline yet again, to 7, making a LL.

Price then rallies once more, to the third yellow dot, but it doesn't make it to 6. It's a LH. It then falls back to the fourth yellow dot, well above the last swing low, and works itself into another rally, all the way to 8.

Thanks again.
 
JTrader said:
(See highlighted lines)I wasn't aware of this. But I'm slightly confused as you then wrote -

Sorry. Making a tentative HL.

Keep in mind that I'm not providing you with a system. I'm addressing the kinds of rules you have to create in order to work with real-time trading calmly and objectively.

If, for example, you define an uptrend as HLs and HHs, and if you further make a HH a condition for a HL, then you don't have a HL until you have a HH either immediately preceding it or immediately following it. The reason for this is that if you don't get that HH, then you're either going to drift sideways or you're going to revisit that "HL". And if you're long, you don't want to be there for that visit. Either way, you're still by definition in a downtrend, and you don't want to be trading counter-trend.

Of course, you needn't define trend this way, but, if not, you have to come up with something that you can recognize in real time.

Is this what confused you?

Db
 
JTrader said:
I'm not sure. But 8 does move 1 pip higher than 6 did.

That's part of it. But it's also the first time that the supply line -- or trendline, if you will -- is broken. This suggests a change in the balance between selling interest (the supply line) and buying interest. (It's also the first time you have a sustained HH.)

With me so far?

Db
 
dbphoenix said:
That's part of it. But it's also the first time that the supply line -- or trendline, if you will -- is broken. This suggests a change in the balance between selling interest (the supply line) and buying interest. (It's also the first time you have a sustained HH.)

With me so far?

Db

Ah yes, I can see that now.
 
dbphoenix said:
Sorry. Making a tentative HL.

Keep in mind that I'm not providing you with a system. I'm addressing the kinds of rules you have to create in order to work with real-time trading calmly and objectively.

If, for example, you define an uptrend as HLs and HHs, and if you further make a HH a condition for a HL, then you don't have a HL until you have a HH either immediately preceding it or immediately following it. The reason for this is that if you don't get that HH, then you're either going to drift sideways or you're going to revisit that "HL". And if you're long, you don't want to be there for that visit. Either way, you're still by definition in a downtrend, and you don't want to be trading counter-trend.

Of course, you needn't define trend this way, but, if not, you have to come up with something that you can recognize in real time.

Is this what confused you?

Db

Hi DBP,
Yes I now understand what you mean. You could have a HH before the HL, but you do not know for sure where exactly the HL is/will be (trying to pin-point the HL/pin the tail on the donkey - for a long entry). If you have a new HH, you can see for sure where the last HL was.
However, by the point that you have a new HH to confirm the last HL, you have often misses the majority of the swing high, and price will often reverse very soon after the new HH - unless a continuing trend establishes itself.
Therefore to go long at this new HH does seem a bit ropey to me.

I didn't realise that this is the definition of HL that you had in mind - a new HH needed to confirm the latest HL...................
This definition of HH, HL, LH, LL - i imagine is very similar to the methodology that Jan Arps Universal Swing Tool (UST) may well use - if you're aware of this indicator. The connections and patterns that the indicator makes on the chart to form price swings/waves look great. I then realised that the signal to go long, is not confirmed until the last down swing has been confirmed, x pips ago. Therefore you would enter the trade maybe 3/4 of the way through the swing/wave/reversal, and price will often soon then look to reverse, unless an extended trend has been formed. This indicators patterns confirm the swing that happened x bars back - confirming the past price action.

Therefore if we need a new HH to confirm the old HL, before going, long, similarly, after you enter the long trade you will find that price often reverses down unless a trend up establishes itself. Similarly, if you need a new LL to confirm the last LH, before going short, price often seems to reverse up soon after the entry point, unless a trend down establishes itself. Our 10-tick chart example/s demonstrates this point well.

Thanks again.
 
Last edited:
It does make sense though - that you need confirmation, such as a HH to confirm the last HL, a LL to confirm the last LH, or even an LH to confirm the last HL, and a HL to confirm the last LH.

Without this second piece of confirming info, price will either be making newer highers or newer lows, or price will be within the range of the most recent HH-LH or LL-HL, and from there price can go up or down.

The trouble is, this second piece of confirming info comes after the move, and trading long when a new HH confirms a recent HL, or going short when a new LL confirms a recent LH, brings us back to the matter of price risk v's information risk 😉.

It could be argued that when you have a HH to confirm the latest HL, or when you have a new LL to confirm the latest LH, whether or not you go long or short at this point, neither option can be favoured over the other. Because it seems unclear which option has the best chance of seeing a successful trade result.

Wouldn't it be nice to be able to get into trades with less price risk (albeit with more information risk), by successfully identifying turns in price direction earlier??
i.e. being able to go long at the right moment after a LL, or short at the right moment after a HH?
Or, does this sound too much like the improbable search for the Holy Grail?

Thanks again.
 
Last edited:
dbphoenix said:
If you're buying this because it's a HL, placing your stop below the bottom of the candle would be inconsistent. It's not a HL until price gets past the previous swing high (the first yellow dot). If it doesn't, you're holding the bag. Rather than be a deer in headlights and hope for the best, get at least to BE.

Like Teresa Lo said to me many moons ago, if it doesn't go, you don't want to be there.


Db

What about if the price had started to go against you as soon as you entered the trade. You can't exit at break even if the trade never went into profit. Where would you place an SL then?

Thanks again.
 
Back
Top