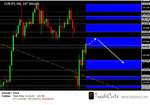
Yen Series...Eur Jpy 19th March

TradeCuts

Member
Messages
68
Likes
1
Hi Everybody,
Starting today until Friday we bring for you one new Yen pair everyday. Each day we will update the previous day's pair. For today, its technical analysis on Eur/Jpy.
So all you Yen lovers... stay tuned !!
Yours Technically
TradeCuts.
 

Attachments

  • eur jpy 19 mar.jpg
    eur jpy 19 mar.jpg
    170.4 KB · Views: 312
Re: Yen Series...Day 2 Aus/Jpy 20th March

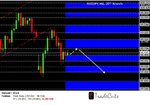
After yesterdays success with the Eur/Jpy pair where both our Take Profits were hit giving us +150 pips,the Yen pair for today is the Aussie-Yen.
The overall out look is for a stronger Yen.
Best
TradeCuts
 

Attachments

  • aud jpy 20 mar - Copy.jpg
    aud jpy 20 mar - Copy.jpg
    181.8 KB · Views: 301
Yen Series...Day 3- Gbp/Jpy 21st March

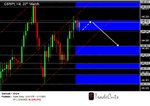
The dollar pushed higher against the yen on Wednesday as market sentiment was supported by hopes that a solution on a bailout deal for Cyprus would be found. Aussie-Yen didn't do very well yesterday and hit our stop loss giving us around 65-70 pips loss.
Todays Yen pair is GBP/JPY and technical analysis says outlook is a neutral to strong yen.
If you take this trade let us know how it works out for you.
Yours Technically,
TradeCuts.
 

Attachments

  • gbp jpy 21 mar - Copy.jpg
    gbp jpy 21 mar - Copy.jpg
    166.8 KB · Views: 303
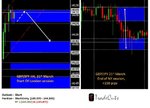
Gbp/Jpy...how it ended,21st March

A fantastic day yesterday with 100% success rate with Yen pairs. Here's a look at the Before & After Chart for Gbp/Jpy for 21st March
Best
TradeCuts
 

Attachments

  • gbp jpy 3 - Copy.jpg
    gbp jpy 3 - Copy.jpg
    91.5 KB · Views: 265
Thanks for your reply.
Much appreciated
:)
TradeCuts

EUR/JPY DAILY as of Thursday, 21 March, 2013
The present wave patterns are:
fast amplitude (8%): bullish wave 1
moderate amplitude (13%): bullish wave 1
Euro Dollar / Japanese Yen is long term Bullish as the 144 days moving average of 114.03 is increasing. The Relative Strength Index is at 53.74 in the neutral territory. The Relative Momentum Index is at 60.15 in the neutral territory. An important indicator for Elliott waves, the Elliott oscillator is at 1.33, in positive territory; this is a bullish sign. An equally important indicator, the STORSI is at 20.72. This value is in the oversold territory.
 
Top