Grey1
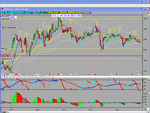
Your MA keeps with the price very well. Applying the trend to the MA as I do looks a very good prospect.
However I realise that I am viewing the chart after the event and most look good afterwards. In real time can it throw false signals or does it keep your out due to its specific weighting.
That is one of the problems with working from the 1 min time-scale, it is fast and furious and with all the data you get on the screen methods of trading can be misleading.
The work I have followed with the 34 ema is that while it misses some of the entry positions, if one follows the correct signal then it works. You will not know how much will be on offer but if you are prepared to take small profits sometimes you do not hold on in hope. The bonus to such a system is it is very visible and easier to follow. However understanding trend, resistence and support is essential.
I also use a 3 sma which is very close to the price but is helpful when following a sudden continuous rise such as in the final stage of a rise (5th wave) when it gets ahead of itself. The ma will give a signal to close early and having seen 3 rising sequences I would close especially if it has gone outside the ema channels from the 15 min timescale.
Before you posted the charts this evening I found your topic quite hard to follow (I am a simple chap you know) any specific works on this that make a good easy flowing read. What charting software are you using.

