User,user said:Good news for the Bulls
Technically the week ahead is known to be fairly bullish. Last week's sell off turned most of the indicators downward and alleviated the overbought condition the market had been in for a while.
Good news for the Bears
The trend is now down on the daily charts and the weekly charts. The Dow has shown great resistance in my stated area of 10600-50 on the weekly charts. The S&P has topped at 1220. The Nasdaq has shown great problems at 2100. The indicators are now down. The VIX hasn't really moved up much and is still at dangerous low levels. The furious down moves shown over the past two sessions basically mean that a continuation is expected or at best upward action will be difficult......
Overall translation
Stats show that next week is 'generally' bullish. However that is not 100%. The downward moves seen over the past few days should be continued. However if we see the Dow gain this week by 1 point then the stats of this week being a bullish one would still be valid. So limited upside is expected if any but follow the trend which is your friend. The S&P500 when closing the week at around 1190 on the weekly chart basically means the following week then does closer even lower. That is true when as far as this year is concerned.
Good luck.......Should be interesting...
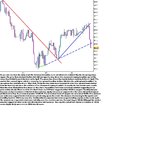
I went short on the SPX at 1200 on Friday (already short on the Dow from Thursday) so I would be interested in what your chart interpretation is on this Index. I'm looking at a target of around 1145 - 1150.