Where is market heading ? Short , Medium Term Grey's analysis

Personally I keep a log of the whole trading day, which allows later review of decisions. Usually a full A4 page of notes in small writing.


Glenn

Glenn,

This is some thing which I have to get used to ,,

Grey1
 
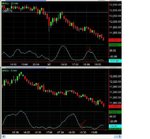
Here are a couple of trades from Monday. Sometimes exiting the trade "too early" turns out to be the right decision. If I had held both these trades until the 5 min played out I would have been worse off. I exited as the one minute started to turn up as I have found over the last couple of weeks (when the market is not behaving technically as Grey1 has pointed out) that it can turn against you viciously as the 1 min exhausts itself. As it happens If I had let the 10 min play out BBY would have shown a bigger profit but that's all in hindsight.

Quick question for Grey1 or anybody that knows, would it ever be ok to hold a trade while the 5 min turned against you if the 10 min was still moving in your direction or is it good practice to exit on the 5 min?

Glad to hear that others are having good succes with Grey1's strategy, helps me to keep going:)

10 min is the key ,, stick to 10 min ,, INDU goes through 10 min cycle and not 5 .. 5 min is bound to go against you while 10 min heading up .

As you get more experience you might be able to read an early detection of 10 min turning ( as you saw in the seminar) using the 5 min but I feel at this stage you should stick to 10 min as your guide line

grey1
 
Here are a couple of trades from Monday. Sometimes exiting the trade "too early" turns out to be the right decision. If I had held both these trades until the 5 min played out I would have been worse off. I exited as the one minute started to turn up as I have found over the last couple of weeks (when the market is not behaving technically as Grey1 has pointed out) that it can turn against you viciously as the 1 min exhausts itself. As it happens If I had let the 10 min play out BBY would have shown a bigger profit but that's all in hindsight.

Quick question for Grey1 or anybody that knows, would it ever be ok to hold a trade while the 5 min turned against you if the 10 min was still moving in your direction or is it good practice to exit on the 5 min?

Glad to hear that others are having good succes with Grey1's strategy, helps me to keep going:)

As we are trading with a mix of discretionary and mechanical criteria it is not surprising that we will each achieve possibly quite different outcomes. It would be nice to think that we could all be as successful as the best but as long as there is a subjective element involved that won't happen. To judge the turns on the macci we may each be setting different levels as when to define OB/OS occurring; +/-70, 80, 90 or plain vanilla 100 (or higher)?

Similarly when deciding when the direction of the macci has changed. I don't have the original TS code so maybe I'm heading off in the wrong direction here but I have to decide how often to look for the turn and get a balance between being too late and having too many false alarms. If we are looking at the 10 min INDU we have at least the options of updating on bar closure (too late?)or on a tick by tick basis (false alarm), or could also choose to update the macci10 every one min or at any other subinterval of 10. I have to own up to trying to use the macci1 and 5 to at least alert me to possible changes in the 10. Although Iraj is trying to dissuade us from trying this, I recall some of his earlier TT posts discussing the birth of a trend where the lower TF initiates the turn. Maybe I misunderstood. Perhaps Iraj would consider a further comment on this.

The methodology provides a framework within which we work. We could all decide to work with exactly the same criteria and minimize the discretionary element as much as possible - but then some would lose out.

No substitute for experience I guess!

Apologies if the above is just stating the b....y obvious.

Al
 
Great idea Iraj, and good news. I'm looking forward to watch you trade again and to trade with you. I have added what you taught us to my momentum trades methods which are based mainly on Bill O'neals CANSLIM formula as explained in the book "How to make money in Stocks", by Bill O'neal.

Zak


I am thinking of arranging 1 day in a MONTH ( EVERY MONTH ) to live day trade so members can make £500 / month following my trades depending on my health . As soon as I make up my mind I will post the date.

Grey1[/QUOTE]
 
Hi Grey1,

thanks very much for the reply. So are you saying that once you have taken an entry using the 10 & 5 min (say they were OS so you went long) you must wait for the 10 min to reach the other extreme ie OB before exiting or looking for another entry? If the 5 min came back to your entry point without having completed a cycle would you stop out on this? (I seem to recall this being mentioned in the seminar)

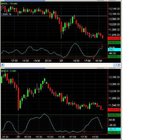
In the 2 charts which I have posted the long entry would have been about 17:30 when the 5 & 10 min turned up. The 5 min then turned without reaching the OB level and the 10 min started to turn down. What would have been the correct action to have taken with this trade? If you had held it the 10 min eventually came back to the entry as well.

I appreciate there are many different scenarios and its impossible to cover them all but anymore clarification on this would really help.
Thanks very much for all your time and effort Iraj,

Regards Mark.
 

Attachments

  • $Indu macci (1).JPG
    $Indu macci (1).JPG
    63.2 KB · Views: 29
  • $Indu macci (2).JPG
    $Indu macci (2).JPG
    59.8 KB · Views: 24
Hi Grey1,

thanks very much for the reply. So are you saying that once you have taken an entry using the 10 & 5 min (say they were OS so you went long) you must wait for the 10 min to reach the other extreme ie OB before exiting or looking for another entry? If the 5 min came back to your entry point without having completed a cycle would you stop out on this? (I seem to recall this being mentioned in the seminar)

In the 2 charts which I have posted the long entry would have been about 17:30 when the 5 & 10 min turned up. The 5 min then turned without reaching the OB level and the 10 min started to turn down. What would have been the correct action to have taken with this trade? If you had held it the 10 min eventually came back to the entry as well.

I appreciate there are many different scenarios and its impossible to cover them all but anymore clarification on this would really help.
Thanks very much for all your time and effort Iraj,

Regards Mark.


Hi Mark-just to reply to your questions which was-

I had a couple of question if you dont mind. Are you just using the stocks with N minute change that Grey1 gave us on the seminar day or have you added to these from his weak/strong list. I have found that on a strong day finding weak stocks to short is quite hard, most of them are strong for the day. I didnt want to mess up by adding stocks that werent good to trade with. You also said you took some shorts as the market opened the other day after it closed strong the night before, I was wondering how you selected the stocks to short as Iraj said N minute change will only work an hour after the open.

1) the stocks which I am using for the Intraday is exactly the same ones which Iraj has given- I do get enough opportunities from these ones so no need to look for more at this stage. In the future if the opportunities decrease then I will look for stocks which meet sthe requirements of a high atr and which trade above a certain volume (discussed by Iraj & Paul many times in this BB)

2) I am selecting strong/weak stocks straight from the 'n minute' as it works like a charm for me. The trick is to identify capitulation when the market is turning and to run if in any doubt- the bulk of my profits are coming from one or two trades and the rest come out with very small profits-actually if I am careful (i.e. by not getting greedy), I find one can come out winners with almost all the trades (anyway it is still very much a learning stage for me).

3) The logic for shorting the stocks during the market open was (if anyone thinks I was wrong then pl. feel free to correct me-I'm still very much a student)- the previous day the indu and the stocks very quite overbought + there vere a couple of stock which were showing acute weakness on the strong day and remained -ve when the market was 400+
+ on the nest next day at opening I was expecting the market will turn at some point soon (slight intraday correction-cyclic theory)- this came at the start and these 2 stocks were still weak as per 'Iran N minute' -so I shorted them- hope this clarifies the point.

Best wishes.

Raj

Edit: just missed a point-from your mail- finding weak /strong stocks from the list is very simple as these are stocks which are weak or strong RELATIVE to the indu.
 
Industry view

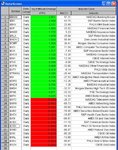
Since I started to use eSignal a few weeks ago I loaded up their symbols for various industries into a Daily Radar.
All it contains is the N-min ATR change column (the other N-min columns are hidden) and the Macci.
It was interesting to see how almost all the Industries were oversold at the low in February, and how the various industries behaved during the sunsequent bounce.
As you can see, at the moment the Strong industries relative to $INDU are all financial followed by Retail.
Likewise the Weakest are the safe havens of Gold and Silver.

Although there is not much to go on in the curent picture, the $OSX Oil Services index is currently getting OS and this would link in to companies such as SLB.

I think that this view could be helpful in selecting the next portfolio for a swing trade, because (in the case of shorting) any stock selected as Daily OB could be compared against its industry as confirmation of Macci status.
Alternatively, if using the top-down approach rigidly, then when the market is OB, the first place to look would be at which Industries are OB, and then to create a portfolio of OB stocks from within those industries, so long as it is diverse enough to spread risk.

Glenn
 

Attachments

  • Industry view.JPG
    Industry view.JPG
    134.1 KB · Views: 38
Sector view

As you know, the overall structure of the US markets is Market - Sector - Industry - Stock
There are 10 Sectors and below is a list of the Esignal Symbols for them.

$DJUSEN Oil & Gas
$DJUSNC Consumer Goods
$DJUSIN Industrials
$DJUSBM Basic Materials
$DJUSHC Healthcare
$DJUSCY Consumer Services
$DJUSTL Telecommunications
$DJUSUT Utilities
$DJUSFN Financials
$DJUSTC Technology

Using the N-Min and Macci with these should give a good overview of Sector Rotation.

There are equivalent symbols on Yahoo for these sectors, but I don't know whether there are any from IB or Tradestation 8 or Neoticker.

Glenn
 
Hi Iraj,

That will be extremely nice of you and very benefecial for all of us I'm sure.

Incidentally, another very nice and profitable day with your intraday strategy (currently I do not have any swing positions).
The Iraj Nminute is so useful that even in a strong uptrending day like today about 50% of my profits came from the selection of stocks as per that tool when the Indu was turning down (i.e. selecting stocks to short).
In the future paltalk sessions, it will be very useful to know a bit more about exiting the profitable trades- at the moment I tend to leave part of meat on the table in the 'take and run pholosophy'..... although even the 'part meat ' gives a good return (y)

Thanks and best wishes.

Raj

Hi Raj,

now that Grey1's leaving the swing trades for a while i guess I've more time to look into intra day trading.

if you have the time i would appreciate it you could post the entries and exits of the trades you took on the 18th

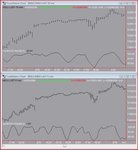
attached is the MACCI indu 10min and 5min

cheers
Glen
 

Attachments

  • Capture.JPG
    Capture.JPG
    82.2 KB · Views: 25
Hi Raj,

now that Grey1's leaving the swing trades for a while i guess I've more time to look into intra day trading.

if you have the time i would appreciate it you could post the entries and exits of the trades you took on the 18th

attached is the MACCI indu 10min and 5min

cheers
Glen

Hi Belfan my friend,

As I am learning along with everyone else and whenever I come across some finer point, I love to post it so that all of us can pick it up (if it is considered to be useful)- I'm not quite comfortable to post my trading details on the BB.

Another point that I have picked up the hard way(although this has been mentioned by Iraj many times-another slap on the wrist I guess)- EVEN IF ALL THE INDICATORS ARE GIVING A PERFECT ENTRY- NEVER TO ENTER THE INTRADAY TRADE DURING THE LUNCH HOURS- Get away from the table between 1600 and 1830!

Best wishes

Raj

Edit: The logic I presume is, all the indicators are effective with a 'healthy' volume of trading in the market.
 
Last edited:
Hi Belfan my friend,

As I am learning along with everyone else and whenever I come across some finer point, I love to post it so that all of us can pick it up (if it is considered to be useful)- I'm not quite comfortable to post my trading details on the BB.

Another point that I have picked up the hard way(although this has been mentioned by Iraj many times-another slap on the wrist I guess)- EVEN IF ALL THE INDICATORS ARE GIVING A PERFECT ENTRY- NEVER TO ENTER THE INTRADAY TRADE DURING THE LUNCH HOURS- Get away from the table between 1600 and 1830!

Best wishes

Raj

Raj, Thanks for the reply

I will keep the 16:00 18:30 thing in mind for my intra day thread

good man
cheers
Glen
 
Another useful filter is to only go long on the 10min or 5min when trin is below 1(by 5 or more points) and not rising, and to only go short when trin is above 1 (by 5 or more points) and not falling.

Consider, do you really want to go short RIMM or AAPL at all on a day like the Monday we just had (24th March 08), when the market is so strong, and when RIMM and AAPL have based for weeks on the daily chart, have good earnings and look like they are going to trend up long term now. I see the MACCI 10min as a great tool to use with fundamentals and technical analysis, but on its own it can often be wrong. I've seen several cases lately on a strong/bullish day when the MACCI 10min goes overbought well above 100 and then turns down for 10 or 15, then back up to well above 100 again.

I totally agree on avoiding the lunch time chop. A strong stock will often fall off a bit during lunch then resume its uptrend after lunch. Reverse for a weak stock on a weak day.

Also, some stocks seem to follow the broader market much better than others. RIMM and AAPL usually follow the market really well, unless they are trending strongly like today. Others are more tricky. I shorted YHOO today 1hour and 23 minutes after open as it was the weakest stock on the list, but it didn't want to come down much, then rallied strongly, then eventually at the end of the day came down to where I went short ($27.55), but I had got out by then, as the rally was so strong.

I'm also sure there are days we shouldn't be day trading at all or only trading the day one way on a technical basis. Beige book is often a gap up on the open then a short all day till the announcement. FOMC is often a gap up on the open, a slow drift down all day till the news, so should only be a short after the gap up. Non Farm Payroll is always crazy and an avoid for 10min macci trading. Would anyone like to add ways to trade other news days. Probably need a calendar made up on how to approach each day.

Also, it could be a good idea to form a group for trading Iraj's intraday methods. This way we could help each other stick to the rules. I'd love it if Iraj would lead the group, so we'd have the benefit of his experience, but if not we could still move forward with this if there are enough active and profitable traders interested. I think theres great merit in using this system, along with other methods. For instance, I do a lot of momentum trading with CANSLIM stocks (Bill O'neals methods), and the 10min macci can be used to buy them after pullbacks when the market is strong.

One other thing. I find the best place to enter is often the first higher low on the 5min macci, (not higher low on the stock chart) rather than as soon as the 10min goes up. This often gives the exact low.

regards

Zak

Raj, Thanks for the reply

I will keep the 16:00 18:30 thing in mind for my intra day thread

good man
cheers
Glen
 
Does anyone know the symbols for TS8.3 for all these sectors? I'd like to set them up in a radar screen too. Anything to get a better edge.

regards

Zak

As you know, the overall structure of the US markets is Market - Sector - Industry - Stock
There are 10 Sectors and below is a list of the Esignal Symbols for them.

$DJUSEN Oil & Gas
$DJUSNC Consumer Goods
$DJUSIN Industrials
$DJUSBM Basic Materials
$DJUSHC Healthcare
$DJUSCY Consumer Services
$DJUSTL Telecommunications
$DJUSUT Utilities
$DJUSFN Financials
$DJUSTC Technology

Using the N-Min and Macci with these should give a good overview of Sector Rotation.

There are equivalent symbols on Yahoo for these sectors, but I don't know whether there are any from IB or Tradestation 8 or Neoticker.

Glenn
 
Does anyone know the symbols for TS8.3 for all these sectors? I'd like to set them up in a radar screen too. Anything to get a better edge.

regards

Zak

Zak,

TS8.3 built in symbol lists give a fairly comprehensive list of sectors/industry groups.

Regards
Graham
 
Now I am going to kick ass day trading even though I prefer not to ,,

Muchas Grasias Mr Market

I am thinking of arranging 1 day in a MONTH ( EVERY MONTH ) to live day trade so members can make £500 / month following my trades depending on my health . As soon as I make up my mind I will post the date.

Grey1

I wish you good health.. look forward to trading with you!
regards,..
 
I get some analysis from a guy. Personally I think he is pretty good. This is what he said late last night after market close:
Stalled, at resistance and over bought
That just about sums up the state of things. This is a critical
juncture for this market for the next several days. The VIX is sitting
on the 200 day MA. Take a look at what happened that last few times
this has happened since last Oct. If you just look at the price the
last 4 days you think wow, big up day and the gains were held. Just
think about this though. The last 3 days the breadth was positive and
yet the market could make no progress. It kind of looks like somebody
was holding the market down, rather then holding it up. The more
normal, and more bullish pattern would be to see negative breadth on at
least 2 of the days. In addition there are technical divergences all
over like the advance/decline line and cumulative volume index. I don't
really like the overall price action either. All the gains came on 4
big up days out of the last 14 trading days. The rest of the days were
sideways or down. Truly the look of an upside correction within a down
trend. Keep that in mind while trading.

Cheers,
Imran.

Quite a confusing market situation I find Imran-thanks for your analysis. The market seemed to push up even with bad employment report, although it could not hold up-maybe the traders are expecting another big cut in interest rates ....
 
market is down to day .. futures down ..

I AM GOING TO GO LONG FOR NEXT few MONTH to day .. All my stocks will be from my STRONG LIST

Just thought to let you know as I promised i would. I am hoping market sells off a lot to day to give me a good entry . I am not sure if this is the pin pointed bottom but i am convinced the market should be trending up for the next few month

INDU currently trading @ 12563

grey1
 
Top