When to sell

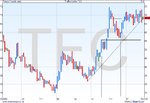
This London stock, TFC, will do for another idea that I've thought of. Say that we are following the trendline and, provided the price remains above the line, we are satisfied with our profit margin for the time period (I position trade, if possible) A sudden jerk upwards to where my thicker horizontal line is will improve my position to about where I would expect to be in about four months time, represented by the 2 verticals. That was the first movement upwards, but if I had waited longer I would be even further ahead of schedule. I would think that was great! If one could get a feel of where one would expect the market to be that far ahead maybe, for instance, if it has had a good run already it may be ready for a fall, then that would help to make the decision of getting out and going somewhere else. Personally, if I had been that far ahead of my target trendline, I think I would have called it a day on a break below my higher horizontal line. It can be see that if I had not sold then I would on the trendline now, end of March, and would have wasted all that time since October.

Split
 

Attachments

  • TFC.JPG
    TFC.JPG
    61.6 KB · Views: 207
firewalker99 said:
I agree, a sudden increase usually coincides with euphoria or capitulation reaction (often accompanied with the typical parabolic rise in price). However, why do you say "above 45 degrees"? Do you give special meaning to trends that move with a gradient higher than that? Like on the attached chart (ER2), where price going steadily higher, without any real retracement... In this particular example the end of the move would be hard to time imo... volume doesn't give much clues away.
A couple of things you need to know about my approach to trendlines.

I use internal trendlines. I will use a line connecting (in an uptrend) the ‘meat’ of the action, not necessarily the low. The close on any bar is ten times more important than the low. I won’t deliberately seek out the close when constructing my trendline, but after I’ve visually located it through the most number of points, the vast majority of times will show the line hitting most of the closes, not necessarily the lows.

After I have constructed my trendline I then adjust my axes to fit it to a 45 degree angle. That establishes my baseline. It’s the deviation from this line that identifies the need for my attention.

Whether you have used, tried, ‘believe’ in Gann and Elliott or not, they both realized the significance of price finding its own path of least resistance. That path is the 45 degree angle.

Most charting software will automatically rescale to give you a best fit for your computer screen. This is good news and bad. By using the above procedure you overcome those limitations/features. Most people do not, they assume what they’re seeing ion the screen is the ‘reality’ of the price slope.

My trendline for ER2 (don’t trade it but looking now) is at 45 degrees (obviously) and held until three quarters the way along when we see parabolic volume increase and it broke down where I would have exited. The trendline then acted at resistance before the final breach at the top again on increased volume.

So no, I wouldn’t have been out at the top but on the first break down through my trendline.
 
Splitlink said:
I was interested in the 45º, as well. There are several factors to take into consideration with a 45º increase. i.e. 45º on a daily chart would not be the same on any other time frame, would it?

In addition there is the price range. Perhaps a %age change would be better if using the same angle as a norm. Apart from that, an exceptionally steep increase in trend looks like a good warning, as you say.
Hi Split.

I don’t want to give the impression I trade trendlines by themselves or in isolation. I don’t. I use a whole bunch of techniques from independent analytical perspectives to obtain a confluence of confirmation. If I don’t get that, I wouldn’t be taking or exiting a trade.

Trendlines are used for both establishing the degree of trend we are in or are not in across various timeframes for any instrument and for getting a signal when the current level of momentum in support of previous price action is altering in some fashion.

If you’re a 5 minute bar trader, you’ll maybe use an hourly, daily, weekly and even monthly higher level timeframe to establish trend in those timeframes. But you’ll only be trading in one of those timeframes. If you’re nicely trundling along a 45 degree slope in your 5 minute trading timeframe and this trend is mirrored in all your higher timeframes that’s cool. You aren’t following the slope of the hourly or the weekly though – just your 5 minute slope.

I’ve already responded to firewalker99 regarding how I fit my 45 degree to any trend so that answers the other part of your question I hope.

In response to your second question you’re addressing other factors that could get you out of a potentially failing trend or act as a warning of a trend break or reversal. I have found it doesn’t pay to get too complex in any one analysis of price and volume. But it does to use lots and lots of them!

Another thing to consider is that many will adhere to the traditional advice given on establishing a trendline break by waiting for (from an existing uptrend) lower highs and lower lows. Sure, that does work, but you’ll more often than not take less out of the trade if you do. I have found that getting out on the break will pay better than waiting for confirmation. You will lose a little if it is just a correction, but hey, you can always jump back on board if the technicals are still valid, and if the trend resumes, and if the trendline is still acting as Support and not now Resistance, which does occur frequently after a break. The sum of losses from a premature exit are small over the long run compared with those associated with consistently waiting to have it proven to you that was the top you just missed.
 
Connie Brown said:
Hi Split.


Another thing to consider is that many will adhere to the traditional advice given on establishing a trendline break by waiting for (from an existing uptrend) lower highs and lower lows. Sure, that does work, but you’ll more often than not take less out of the trade if you do. I have found that getting out on the break will pay better than waiting for confirmation. You will lose a little if it is just a correction, but hey, you can always jump back on board if the technicals are still valid, and if the trend resumes, and if the trendline is still acting as Support and not now Resistance, which does occur frequently after a break. The sum of losses from a premature exit are small over the long run compared with those associated with consistently waiting to have it proven to you that was the top you just missed.

Good advice, thanks. Apart from trading (not much intraday, mostly anything up to nine days) I have a small portfolio of shares because I'm not a great believer in cash earning interest in the bank. This portfolio being a long term hold and buy situation, I don't sell very often and I would like to confirm that what you say is true for them, too. Getting out on breaks after a sharp uptrend away from the norm, would have saved stagnation for several months on several occasions and would have enabled me to put the money somewhere else. Although, I can't complain, I would have done better by selling at the break and reinvesting. Perhaps, this is a case of falling in love with the shares or just being a bit lazy.

Regards Split
 
Connie Brown said:
A couple of things you need to know about my approach to trendlines.

I use internal trendlines. I will use a line connecting (in an uptrend) the ‘meat’ of the action, not necessarily the low. The close on any bar is ten times more important than the low. I won’t deliberately seek out the close when constructing my trendline, but after I’ve visually located it through the most number of points, the vast majority of times will show the line hitting most of the closes, not necessarily the lows.


In the particular case of the e-minis (i'm sure it is also true for the rest), i like to see a graphic on 1000 contracts, and draw my trendline crossing (h+l)/2..
try it, and compare it with other volume frames, i believe it will give you a nice notion of momentum.. ;)
 
all the indicators mentioned here r derived from the price

i.e. moving averages, ....
does it make sense to use indicators which r nt directly correlated to the price ?
the correlation coefficient is decreasing when u r increasing the time period of moving averages.
Is it what u want. ? NO
what is it what u want ? u would like to increase your correlation coefficient.

what does this mean ? get rid of every analog indicators
 
Top