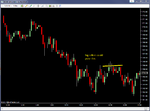
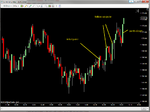
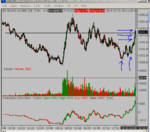
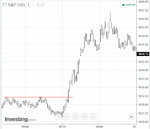
What I think is better for me is when the market gets into the tighter 6-8 tick ranges where you know stops are either side. If this range happens after a move up, you know there's a slightly higher chance of an upside break, so you get in @ the low of the range, scale some close to the top and then sit on it in an effort to capitalize on the break. You could well get stopped out on it and you could get shaken out with a poke through the range that then fails before it goes upside but I think on balance, it's a better way to play it (for me).
No idea if this post will resurrect the thread, but in my opinion it represents one of the few good ones as it deals with market structure and the auction process, all of which are too often ignored for things like moving averages and other guff.
Am posting to help others try to work out the clues, and to also order my own ideas and out them down onto paper.
The quote I've included above from DT is an actual workable trade idea which I do use, and most importantly, you will see this pattern on practically every single trading day.
And why does this work consistently? AS DT says:
"The point is - there IS a fair amount of short term speculation going on. The percentage differs depending on what's driving the day. It does NOT have to be retail speculation for people to be wrong.
So - I wouldn't underestimate trapped traders as a force to drive a short term move because they are clearly visible as they exit."
So how does this info work on a tradeable basis?
For me, it goes into the age old argument about support and resistance and what it actually represents. For example, what is the head and shoulders pattern and what does it tell you in terms of analysing who is buying and selling on this formation and why. This sums up the problem with many posts on trading-we talk about the pattern and yet don't analyse what the pattern represents in the same way that no-one studies the meaning of the idea that a price tends to break on the third test of a level. Why is that??
I'm on a laptop so cannot post charts at the moment-if anyone is interested I'll continue talking about this and see what other people have to say on the subject as whilst I think I'm correct, there may be further insights by others.


