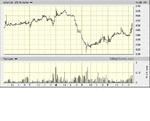
Volume tells all

Pttrader,

I need time to digest all of that but, yes, it makes a lot of sense to me. Thanks a lot. I was stopped out on these two this morning, one was in profit and helped me subsidise the other. I'm sure that you and Chump
have helped me a lot.

Regards

Split
 
Splitlink said:
Pttrader,

I need time to digest all of that but, yes, it makes a lot of sense to me. Thanks a lot. I was stopped out on these two this morning, one was in profit and helped me subsidise the other. I'm sure that you and Chump
have helped me a lot.

Regards

Split
Forecast for 13 oct.

*This post edited adding the rule for the forecast made in this post as I didn't give the rule in the original post.*

RULE: When a downtrend has been in place a low range closing on higher than average volume on a larger than average range indicates price will probally be lower for at least one or two days. If it had close on the high ot would mean demand is coming back in.

PRU
Short-term trend is down looking to go sideways but probally only for a few days (sideways that is). If you look at a 1 year daily chart you can see that it is in distribution and tracking sideways (long term view) It closed weak wed with a small volume increase over previous days bar so I still expect it to perhaps slide a down some more thursday or at best to start tracking sideways for a few days (short term) if it doesn't break wed low of 63.90. Longer term is sideways at this point but could change to down trend once distribution is over. Short term downtrend is still intact until more buying pressure shows up thus indicating demand is coming back in.

wpp
Heavy slide to south today on high volume. A one year chart shows it to be in a markdown phase. Accummulation has not started yet that is why the slide south on wed. A little demand started coming back in by the close but it is still weak. General trend is down. I expect it will break below wed (today's) low of 10.76. Longer term trend at the present is south until tape says demand is coming back. Possible short term shorting candidate but could enter accumulation anytime.

Glad you got out split with only one loss.
 
Last edited:
Split

*Edited to clarify but basic rule same as before edited.*

RULE used for 14th "When a downtrend has been in place a low range closing on higher than average volume on a larger than average range indicates price will probally be lower for at least one or two days. If it had closed on the high it would mean demand is coming back in."


Don't know where you are at but here is what I seen for PRU and WPP on 14th tomm.

PRU

Today 13th PRU did as forecasted. Volume was up over yesterdays volume and price closed weak however, the range was not very big. I still expect lower prices for the 14th but maybe not very far. Possible shorting opportunity early in the session if prices head south.

I said on the 12 th "I still expect it to perhaps slide a down some more thursday " and that the short term downtrend was still intact. That is what happened. It is not yet in accumulation. As of yet no smart money is supporting it therefore, I think it will head south again tommorrow 14th. Of course, any time "smart money" could begin supporting it and stopping the decline but on the day they do it we should see it on the bar. As of now after thursday's close it is still weak with NO buying pressure. Weak close, higher volume than previous bar, lower prices than previous bar all point towards continued weakness until smart money decides to support it.

wpp

This is a tricker one to call. However the same rule above used for PRU can be used here. However again the range wasn't very big which could affect the forecast. Nevertheless, I expect lower prices tommorrow 14th. The reason why this one is harder to call is because some demand came back in today. I thought prices would have dropped more today but the narrower range, high volume (albeit LESS volume than yesterday's volume), and closing with a higher close than yesterday's close indicates some buying pressure came in today. However, the fact that it didn't penetrate the resistance line at $11.19 plus closed near the low of the day indicates to me that there is still weakness. If smart money was ready to take it up tommorrow I would have expected to see a higher close on greater volume than thursday volume thus indicating institutional buying. And breaking thru of the 11.19 resistence level on higher volume with a higher close just would have been more confirmation.. Because this didn't happen I lean towards it sliding south some more tommorow. However, if I am wrong and demand starts to come in fast within first hour of open and begins to drive prices up then I would change my opinion and look at going long as that would indicate demand is coming in. Or I could wait until monday to take a long position if Friday 's close indicates to do so.

So, even though it is possible demand could start coming in tommorrow the odds favor it going down more tommorrow so I will stick with that forecast at the present. It is still weak at today's close.
 
Last edited:
Forecast for monday October 17th
PRU

Three rules in play for Mondays forecast

1) "When a downtrend has been in force a downbar with a high range closing on higher than average volume and with a bigger than average range indicates price will probally rise as smart money is buying. The higher the volume and bigger the range the greater the rise tends to be"

2) A high volume wide spread up bar closing in the middle of the range or above and that is preceeded by one or two a high volume down bars indicates strenght has come back into the market.

3) A high range closing on higher than average volume regardless of the present trend (up or down) implies immediate higher prices


Demand came back in today early in the session. Smart money stopped the decline and did so early in the session. This demand coming in early like this should have been the clue that the decline is over for the moment and one has a chance to now go long. Or go long on monday. I really didn't expect the demand to back in today but when you see that happen you have to shift gears and go with what is happening. I did say that smart money could start back supporting any time and the bar would tell when they did in fact do so. It happened today and the bar shows it. I also said that of the 2 stocks PRU was the least dangerous for a long position but one would have to grit their teeth and hang on. Today it has come back quite abit. .

Outlook for monday is UP or at worst sideways. Possible chance to go long early monday.

Wpp

It did go lower as I thought it might and did so early in the session. After that demand started coming in and it closed strong. What happened today is simply that it was first taken down taking out stop losses then a little before 10:30 demand began to come it and drive the price up. This demand simply absorbed the supply. If there is little supply left after today then it has a good chance of going up monday. On the other hand if there is still supply left it may take a day or two of tracking sideways to absorb it before prices head north. Smart money was eating at the supply today. They are buying while the public is selling!

Outlook for monday: UP - or at worst sideways. A chance to possibly go long if one see demand early in the session..
 
Last edited:
pttrader said:
PRU

Demand came back in today early in the session. Smart money stopped the decline and did so early in the session. This demand coming in early like this should have been the clue that the decline is over for the moment and one has a chance to now go long. Or go long on monday. I really didn't expect the demand to back in today but when you see that happen you have to shift gears and go with what is happening. I did say that smart money could start back supporting any time and the bar would tell when they did in fact do so. It happened today and the bar shows it. I also said that of the 2 stocks PRU was the least dangerous for a long position but one would have to grit their teeth and hang on. Today it has come back quite abit. The rule: A high volume wide spread up bar closing in the middle of the range or above and that is preceeded by one or two a high volume down bars indicates strenght has come back into the market.

Outlook for monday is UP or at worst sideways. Possible chance to go long early monday.

Wpp

It did go lower as I thought it might and did so early in the session. After that demand started coming in and it closed strong. The rule: A high range closing on higher than average volume regardless of the present trend implies immediate higher prices. What happened today is simply that it was first taken down taking out stop losses then a little before 10:30 demand began to come it and drive the price up. This demand simply absorbed the supply. If there is little supply left after today then it has a good chance of going up monday. On the other hand if there is still supply left it may take a day or two of tracking sideways to absorb it before prices head north. Smart money was eating at the supply today. They are buying while the public is selling!

Outlook for monday: UP - or at worst sideways. A chance to possibly go long if one see demand early in the session..

You are very kind to keep watching PRU and WPP. Now that we are on the weekend I intend to study your arguments in greater detail. Thanks a lot- much appreciated.

Regards Split
 
Hi Pttrader,

I've been studying your posts and the intraday and daily PRU. I'm not going to say that I understand all your arguments, but I have been able to spot the high close on the wide ranging price bar, accompanied by high volume on Friday at about 1.15 pm. Could Friday's volume be considered as heavy, considering that the previous afternoon's was more than twice as much and for a much longer period of time? I do see, though, that after the initial surge, the volume faded to nothing by the Thursday's close, falling and picking up again on Friday in the manner that you described and what I would have interpreted as a potential change of trend, (if I'd seen it) which had been signalled by the volume activity mentioned by you.

I haven't been able to spot too much on the daily chart,though. Maybe that's because there isn't much to spot.

I'm hoping that this thread will catch on by others who are not convinced by volume activity but who, nevertheless, want to learn more.

Thanks again

Split
 
Last edited:
Fader said:
Price action takes volume out the back...
Put first things first. It takes volume to have price action. No volume and price NEVER goes anywhere. People can play all day long raising and lowering bid/ask prices but until someone hits either the bid or the ask and purchase or sells a quantity (volume) you have nothing. Price in itself does not move price. Volume CAN move price. Any sustained price move has to be made with volume or it will dry up and fade away. Doesn't it make sense to analize what is many times the "cause" of price movement? Think about it!
 
Splitlink said:
Hi Pttrader,

I've been studying your posts and the intraday and daily PRU. I'm not going to say that I understand all your arguments, but I have been able to spot the high close on the wide ranging price bar, accompanied by high volume on Friday at about 1.15 pm. Could Friday's volume be considered as heavy, considering that the previous afternoon's was more than twice as much and for a much longer period of time? I do see, though, that after the initial surge, the volume faded to nothing by the Thursday's close, falling and picking up again on Friday in the manner that you described and what I would have interpreted as a potential change of trend, (if I'd seen it) which had been signalled by the volume activity mentioned by you.

I haven't been able to spot too much on the daily chart,though. Maybe that's because there isn't much to spot.

I'm hoping that this thread will catch on by others who are not convinced by volume activity but who, nevertheless, want to learn more.

Thanks again

Split
Split,

I am doing chart reading on EOD for my forecast. All of my correlation of volume with price is on a daily bar chart. However, I only look at intraday to detect demand/supply coming in that could change the previous days forecast made from its own daily bar chart. In other words, you have a tape reading forecast at the end of each day but that must be compared with the intraday action. If any differences arise between the daily forecast and the "actual" price action then one has to shift gears. However, many times they are right on. Look at how PRU only partly fullfilled the forecast made on thursday for friday. Example: Forecast on thursday for PRU after close was a continuation of the downtrend but that at any time smart money could begin supporting it. The intrady on Friday helped one to see that instead of a continuation of the down trend this demand from smart money did in fact come in although I didn't expect it so soon. Demand increased from about 10:30 to after 12:00 however, there was a large spurt of volume just belore 12:00 that would indicate to me that a top was being made. Then price meanders down but still closes high thus giving the high close on the daily bar for Friday and indicating that demand was still strong at the close. Thus the UP forecast for Monday. The EOD on Friday for Monday is UP at worst sideways because the Friday daily bar shows demand. Monday intraday will have to be watched to see if that buying pressure "hold" increases, or dries up. The probabilities favor demand driving monday's price higher than Fridays high but one must always compare "actual" volume and price action with forecasted from the daily bar chart. This comparison is done by using intraday. The forecast is daily. The intra day either confirms or negates the forecast. One takes a position depending on what happens. The forecast is useful to give one a "view" to what will probally happen. The "actual" price action correlated with intraday volume fine tunes the position one will take.. Does this make it easier to understand or have I just complicated it more?

Remember EOD daily bar chart for PRU on Friday indicates price will continue up on Monday or at worst case track sideways on Monday. Come monday one needs to watch intraday price action correlated with intraday volume to detect "what" is in fact taking place. That is, a sideways movement or an up movement. If the daily forecast made on Friday is totally wrong (and sometimes is) then price will go down.

This type of tape reading is only for 1 to 3 days.
 
Fader said:
Price action takes volume out the back and beats the sh1t out of it

That's been my view, too, but Pttrader's explanation gave warning of a potential trend change on Friday BEFORE the price pattern formed. Of course, it's early days yet, but everyone needs all the information that's available, so I am watching how it goes. I suspect that you are, too, or you wouldn't be here! :)

Split
 
pttrader said:
Put first things first. It takes volume to have price action. No volume and price NEVER goes anywhere. People can play all day long raising and lowering bid/ask prices but until someone hits either the bid or the ask and purchase or sells a quantity (volume) you have nothing. Price in itself does not move price. Volume CAN move price. Any sustained price move has to be made with volume or it will dry up and fade away. Doesn't it make sense to analize what is many times the "cause" of price movement? Think about it!
".. until someone hits either the bid or the ask and purchase or sells a quantity (volume) you have nothing". Wrong, you can have price without a transaction which is something. You cannot normally have volume without price, though.

Look at volume in a volume bar chart, say the YM. Each bar consists of the same volume. Generally, the bars are longer on a faster price rise (as on a faster price fall); this tells you that same volume equates to more points in a fast rise. As I said before its sellers retreating that create the price rise. It is better that you use quite a reasonable amount of volume per bar to see this illustrated.

Again a lot of imaginings are attributed to the volume in price movements. Nothing will stop these unjustified imaginings and I don't mind everyone and his dog being wrongly diverted. When price spikes you have sellers taking fright and retreating very fast to make the apex; next the momentary top and suddenly buyers taking fright with buyers retreating very fast. Those that have spent years, sometimes decades, meandering on about volume, will try and rationalise their ramblings if the actuality of what really happens is ever brought to their attention.
:)
 
Pttrader,

The daily price closed up above the halfway mark on Friday's close but the volume was no great shakes, was it? I can't see anything there that would make me want to investigate further.

Tell me, would you have been attracted by the daily chart of this share if I had not brought it up for study?

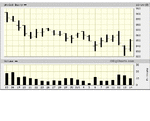
I'm sending two charts of GUS, I hope you can see them OK. Do you think that this has better prospects than PRU? The daily bar on Thursday was strong , as was Friday's. The daily volume was much higher then PRU and would, after reading your posts, cause me to watch the intraday action. If you agree, then you are a good teacher and I am learning!

Split
 

Attachments

  • GUS Daily.gif
    GUS Daily.gif
    12 KB · Views: 270
  • GUS 5 day.gif
    GUS 5 day.gif
    14.4 KB · Views: 286
fudgestain said:
".. When price spikes you have sellers taking fright and retreating very fast to make the apex; next the momentary top and suddenly buyers taking fright with buyers retreating very fast. Those that have spent years, sometimes decades, meandering on about volume, will try and rationalise their ramblings if the actuality of what really happens is ever brought to their attention.
:)

I'm slipping away from you, mate. Grab me before it's too late! :LOL:

Split
 
pttrader said:
Put first things first. It takes volume to have price action. No volume and price NEVER goes anywhere. People can play all day long raising and lowering bid/ask prices but until someone hits either the bid or the ask and purchase or sells a quantity (volume) you have nothing. Price in itself does not move price. Volume CAN move price. Any sustained price move has to be made with volume or it will dry up and fade away. Doesn't it make sense to analize what is many times the "cause" of price movement? Think about it!
Volume is handy for telling when a move has dried up, I use it maybe half a dozen times a session, taking your scenario a step further it is people that cause volume, should i round up every trader in the market and study their psychological profile, hang on, their parents produced them, i better study them too, uh oh, now i have to interview god because he is really responsible for all this volume... line has to be drawn somewhere... that somewhere is price action... nothing else matters
 
When prices advance on light volume prior to a price peak. Once the high exceeded, I look for volume to increase significantly, for two reasons first, I expect to see short covering and stop loss buying to occur at and above the old price high,

Second, trend followers are likely to initiate positions precisely at that price high and above.Consequently, I like to see volume explode subsequent to a breakout above a previous high but not before. The same observations apply to declines.But it has got to be light volume prior to the breakout

I like to keep it simple. and the above is as simple, as you can get, in looking at Volume
 
Last edited:
pttrader said:
Put first things first. It takes volume to have price action. No volume and price NEVER goes anywhere. People can play all day long raising and lowering bid/ask prices but until someone hits either the bid or the ask and purchase or sells a quantity (volume) you have nothing. Price in itself does not move price. Volume CAN move price. Any sustained price move has to be made with volume or it will dry up and fade away. Doesn't it make sense to analize what is many times the "cause" of price movement? Think about it!

If you mean "no volume" literally, then of course price isn't going to go anywhere since there will be no trade. But to say that volume precedes price is inaccurate. If one watches charts play out in real time, he will see volume follow price nearly every time. The price movement, even if orchestrated, attracts attention. The volume comes after the trigger, not before.

Even if there's little volume thereafter, however, price can move substantially as long as there is sufficient demand to move it. Volume often doesn't increase until a surge of supply enters the market, at which point buyers have to either fish or cut bait. In the meantime, price can rise for months on relatively light volume, particularly if the angle of ascent is gradual (not, for example, parabolic).

And while it may "make sense" to analyze the cause of price movement, the activity is irrelevant. By the time one knows the cause, the best entry point is gone, increasing the price risk. The market tells you what to do. But you have to learn to listen.

--Db
 
VSATrader said:
I think that all my posts designed to enlighten you all has failed completely, so I will now stop posting any more. I think that an intelligent person would keep an open mind about anything, not just dismiss as most seem to do. If you don't have the knowledge yet, determination will get you there. Afterall, mankind had to experiment to build the things we now take for granted: satellite:the Space Shuttle etc, So did they dismiss it all and say 'well we never built that before, so it cannot work?' No they designed and redesigned until they got it right.

Please enjoy the last four charts. I know most of you won't understand them, but with a little study, you never know.

Regards VSAtader

Hi VSATrader, as a new purchaser of TradeGuider I have to agree with everything you say. Reading the Master the Markets book which comes with the software totally opened my eyes to the importance of volume and its impact on price. In particular the concept of "sterngth appears on down bars" and "weakness on up bars" is worth the price alone of the software. I have a few questions which arent covered in any detail which you may be able to advise on:

How do you define a test and a hidden test?

Why does a wide spread up bar indiciate supply hitting the market? (I short these most of the time, where I would go long previously)

What is a hidden upthrust?

Also, have you ever applied the principles to Cruide Oil futures?

Thanks

Indy2005
 
VSATrader said:
Please enjoy the last four charts. I know most of you won't understand them, but with a little study, you never know.

Regards VSAtader
If you are that fragile that you cant accept others opinions then you probably shouldn't be trading, and yes we understand your charts, what do you think made it so easy to blow holes in your arguments?
 
Splitlink said:
Pttrader,

The daily price closed up above the halfway mark on Friday's close but the volume was no great shakes, was it? I can't see anything there that would make me want to investigate further.

Tell me, would you have been attracted by the daily chart of this share if I had not brought it up for study?

I'm sending two charts of GUS, I hope you can see them OK. Do you think that this has better prospects than PRU? The daily bar on Thursday was strong , as was Friday's. The daily volume was much higher then PRU and would, after reading your posts, cause me to watch the intraday action. If you agree, then you are a good teacher and I am learning!

Split
Split,


UK: GUS

Maybe I need to clarify something about volume. I look at volume ONLY in terms of the average volume of a particular stock. In other words, GUS had more volume (numberwise) than PRU but if you look at the daily bar chart PRU was a little more above its average volume than GUS was above it's average volume. Therefore, I see PRU as a little bit stronger than GUS. Why? GUS had a decrease in volume when compared to thurs and wed volume. In other words, Friday volume was LESS than thursday volume which is the day that demand (or buying pressure) came back in. This demand is seen by the larger than average range on thurs being made with higher than average volume and closing strong. If no smart money would have entered in the market on thursday it surely would have close weak for the trend at the time was sideways to DOWN. This volume made Thursday represented panic selling by the public to smart money. Smart money bought everything in sight, took out stop losses, and before the day was over their buying created demand thus the high close. It surely wasn't the public that made the high close! They got burn't on the gap down open on thurs. and the smart money just drove it down triggering every stop loss they could that the public had in place. Once they took them out smart money continued buying and it ended up closing high. All of this was confirmed by the bar on Friday breaking thru thursday's high and closing strong. I am sure smart money sold some right back to the public Friday that they had just bought yesterday from the public! However, we have to look at the volume and correlate that with the price action that was made friday. If you just look at the price action one would say it is strong. But when you look at "how" that price was made (volume) you can see a little weakness coming into the market. How is this weakness detected? Look at the volume the last 3 days. True, price was higher on Friday but volume on Friday was LESS than the two previous day's bar nevertheless, volume on Friday was a little bit above the average volume for the instrument. What does all this tell me? It simply says while GUS is still strong it is getting weaker. I suspect it may go up a little further to 860 resistence, and then If it pushes on thru on high volume then look out it is going on up and smart money will unload it on the public as they drive it up. They will make the public think it is going on up! If it hesitates at the this resistance then it will probally track sideways for a day or two and smart money will either unload their shares they bought thursday as it tracks sideways or they will accumulate more shares if their intention is to push it up more at a later date.

PRU
Close weaker on friday but had a little more volume than GUS when you look at it in terms of average volume for PRU. So, that tells me there is still some gasoline on the fire. How much it is hard to tell but if it breaks thru resistence at 65.75-66.00 level then i would say it is heading more north. If it hesitates at that level or doesn't make it there monday then I would say we are looking at a sideways trend for a day or two. I lean towards it going on UP as volume didn't drop much and it went up on Friday closing fairly strong..all this dies indicate some strenght still left. Monday will tell us just how much.

As far as me being attracted by PRU if you had not brought it up I probally wouldn't have but not because there was nothing about it's volume or price that would attract. I just don't trade stocks in that price range. I see a greater return on capitol in cheaper priced stocks. I daytrade / swing trade stocks and futures.

You certainly did pick a market (GUS) that embodied the principles I have been discussing and you read it correctly except for the possible misunderstanding on volume. It is not numberwise but it is volume compared to it's own average volume.

So, both are still strong but I see PRU as a little bit stronger. Both are potential longs but one needs to watch the intraday and don't ride the long up too high UNLESS resistance levels are broke on rising volume.
 
Fader said:
If you are that fragile that you cant accept others opinions then you probably shouldn't be trading, and yes we understand your charts, what do you think made it so easy to blow holes in your arguments?
Fader,

You wouldn't be fading the volume would you??? Just kidding!
 
Top