Volume tells all

grantx said:
Following this thread has convinced me of the importance (primacy?) of volume. Some time ago I copied most of this thread into a Word document (and its one large file) for later study.

My problem was accessing and extracting relevant data from my feed. Now I’ve written an Excel programme to do this. This is the data I extract: time, last, last size, bid, ask, bid size, ask size.

From this I determine change from last, change on bid, change on ask, whether last trade was at bid, ask, mid, below bid, above ask. The time period can be tick onwards. I don’t know which of these is relevant or how to interpret the various elements. Would someone please give a brief synopsis, suggest other elements/factors to consider, improvements to the programme. I really don’t feel like trawling through that Word document at the moment.

Possibly of secondary value, I also record where the last is in relation to open, high, low, previous close, fair value.

Thank you in advance.

Grant.

IMHO this is the right approach. Speculative musings about smart money are all well and good, but nothing beats the hard graft of actually looking at the market. You could read this thread over on ET for discussion of market delta (ratio of trades at ask to trades at bid):

http://www.elitetrader.com/vb/showthread.php?s=&threadid=78980

Also read up on market profile. I have no doubt that some SIF markets 'take notice' of market profile levels.

A key component of understanding SIFs is to get a handle on how the order book behaves. I posted some stuff on the above thread that I think is interesting. If Paul Rotter says you gotta understand the order book to trade futures well, that is good enough for me.
 
Volume Schmolume

grantx said:
Following this thread has convinced me of the importance (primacy?) of volume. Some time ago I copied most of this thread into a Word document (and its one large file) for later study.

My problem was accessing and extracting relevant data from my feed. Now I’ve written an Excel programme to do this. This is the data I extract: time, last, last size, bid, ask, bid size, ask size.

From this I determine change from last, change on bid, change on ask, whether last trade was at bid, ask, mid, below bid, above ask. The time period can be tick onwards. I don’t know which of these is relevant or how to interpret the various elements. Would someone please give a brief synopsis, suggest other elements/factors to consider, improvements to the programme. I really don’t feel like trawling through that Word document at the moment.

Possibly of secondary value, I also record where the last is in relation to open, high, low, previous close, fair value.

Thank you in advance.

Grant.


There may be variations between different Exchanges but: -
There are ways to hide volume so that it never appears on a chart. i.e. Iceberg Orders, Hidden orders.
Likewise the display of volume can be delayed by choice if the organisation placing big orders so wishes.

Such methods are most likely to be used by the bigger players trying to diguise their hand.
It is also the case that it is the bigger players who are moving the market or determining it's direction, which is what most volume readers are trying to determine.
So why do these methods exist and why are they allowed ? Because the big boys insist on it in order to hide their intentions from the prying eyes of their competitors, and therefore it is allowed by the exchanges and regulatory authorities.

So how do those of you who have such faith in volume take account of this ?
The very information you are trying to interpret, and quite possibly the largest proportion of it, is often being hidden from your view.

I have no axe to grind here, but this aspect of volume is rarely mentioned and needs to be understood imho.
Glenn
 
Glenn said:
There may be variations between different Exchanges but: -
There are ways to hide volume so that it never appears on a chart. i.e. Iceberg Orders, Hidden orders.

Iceberg and Hidden orders hide size in the order book. If the orders are filled, then volume is reported.

You need to be specific about which markets where volume is being hidden. I very much doubt that it is the case on Globex, Eurex etc.
 
Last edited:
dcraig1 said:
Iceberg and Hidden orders hide size in the order book. If the orders are filled, then volume is reported.

You need to be specific about which markets where volume is being hidden. I very much doubt that it is the case on Globex, Eurex etc.

"If the orders are filled, then volume is reported."
That doesn't seem to be the case when you read the following from IB: -

"Iceberg orders allow you to submit an order (generally a large volume order) while publicly disclosing only a portion of the submitted order."
"You want to buy 5000 shares of XYZ stock but only want to show a buy order of 200 shares. You create a limit order to buy 5000 shares of stock XYZ. From the TWS Page menu you select Layout, and in the Columns – Order Row section you scroll down to the Disp. Size entry and check it. Back on the trading screen you select Smart in the Destination field, and enter 200 in the Disp. Size field. Transmit the order. Your order is submitted, but it is displayed as a buy order for 200 shares of XYZ. "


"A Hidden order allows you to submit an order (generally a large volume order) without publicly disclosing the order information."
"A Hidden order (generally a large volume order) shows no evidence of its existence in either the market data or the deep book. "

"You want to buy 5000 shares of XYZ but don’t want your order to be seen by other traders in the market. You create a limit order to buy 5000 shares. From the TWS Page menu you select Layout, and in the Columns – Order Row section you scroll down to the Hidden entry and check it. Back on the trading screen you select INet in the Destination field, and check the box in the Hidden field. Transmit the order. Your order is submitted but evidence of the order is hidden from the market data and INet deep book. "

Glenn
 
Glenn said:
"If the orders are filled, then volume is reported."
That doesn't seem to be the case when you read the following from IB: -

"Iceberg orders allow you to submit an order (generally a large volume order) while publicly disclosing only a portion of the submitted order."
"You want to buy 5000 shares of XYZ stock but only want to show a buy order of 200 shares. You create a limit order to buy 5000 shares of stock XYZ. From the TWS Page menu you select Layout, and in the Columns – Order Row section you scroll down to the Disp. Size entry and check it. Back on the trading screen you select Smart in the Destination field, and enter 200 in the Disp. Size field. Transmit the order. Your order is submitted, but it is displayed as a buy order for 200 shares of XYZ. "


"A Hidden order allows you to submit an order (generally a large volume order) without publicly disclosing the order information."
"A Hidden order (generally a large volume order) shows no evidence of its existence in either the market data or the deep book. "

"You want to buy 5000 shares of XYZ but don’t want your order to be seen by other traders in the market. You create a limit order to buy 5000 shares. From the TWS Page menu you select Layout, and in the Columns – Order Row section you scroll down to the Hidden entry and check it. Back on the trading screen you select INet in the Destination field, and check the box in the Hidden field. Transmit the order. Your order is submitted but evidence of the order is hidden from the market data and INet deep book. "

Glenn

Yes, it's hidden in the book ie does not show in market data bid or ask size or in the DOM, but should it be filled, the trade is reported in the volume. Your intention is hidden from the market, but not the fill of such an order.

I think the Iceberg orders are simulated by IB which will submit an order of a type native to the exchange when the limit condition is triggered. Problem is that portion of your order that is not showing will go to the end of the queue.
 
dcraig1 said:
Yes, it's hidden in the book ie does not show in market data bid or ask size or in the DOM, but should it be filled, the trade is reported in the volume. Your intention is hidden from the market, but not the fill of such an order.

I think the Iceberg orders are simulated by IB which will submit an order of a type native to the exchange when the limit condition is triggered. Problem is that portion of your order that is not showing will go to the end of the queue.


"should it be filled, the trade is reported in the volume"
Perhaps you can point us to where that is officially stated to be the case. It is not mentioned in the IB definitions.

"I think the Iceberg orders are simulated by IB which will submit an order of a type native to the exchange when the limit condition is triggered. Problem is that portion of your order that is not showing will go to the end of the queue."
If so, then how does this affect the volume data which people can see and are trying to interpret ?

And what about delayed orders, the volume of which is definitely delayed to data feeds and thereby to charts, and which are certainly commonplace in the UK market , if not elsewhere.
Glenn
 
Glenn said:
"should it be filled, the trade is reported in the volume"
Perhaps you can point us to where that is officially stated to be the case. It is not mentioned in the IB definitions.

IB is not responsible for reporting volume. It just passes on the data provided by the exchange. In the section on their site describing the various order types they are defining how orders (either native or simulated) operate, they are not describing how the various exchanges report trades. They are quite separate issues.

"I think the Iceberg orders are simulated by IB which will submit an order of a type native to the exchange when the limit condition is triggered. Problem is that portion of your order that is not showing will go to the end of the queue."
If so, then how does this affect the volume data which people can see and are trying to interpret ?
Whatever portion of your order is filled should be reported in volume. If you missed out and got only a partial fill the remaining portion is not reported as it was not traded.
And what about delayed orders, the volume of which is definitely delayed to data feeds and thereby to charts, and which are certainly commonplace in the UK market , if not elsewhere.
Glenn

I dunno about LSE. I remember reading somewhere that some funny business goes on with volume reporting. This is what I meant about identifying markets where volume may not be accurately reported. I'm not familiar with LSE so I don't know. One of the attractions of stock index futures is a fairly transparent and fair market compared to some others. I am under the impression that all volume is reported accurately on the major futures exchanges - sometimes too accurately with huge blocks going through on spread trades near rollover date making a mess of charts and of no interest to directional traders.
 
Last edited:
dcraig1 said:
IB is not responsible for reporting volume. It just passes on the data provided by the exchange. In the section on their site describing the various order types they are defining how orders (either native or simulated) operate, they are not describing how the various exchanges report trades. They are quite separate issues.


Whatever portion of your order is filled should be reported in volume. If you missed out and got only a partial fill the remaining portion is not reported as it was not traded.


I dunno about LSE. I remember reading somewhere that some funny business goes on with volume reporting. This is what I meant about identifying markets where volume may not be accurately reported. I'm not familiar with LSE so I don't know. One of the attractions of stock index futures is a fairly transparent and fair market compared to some others. I am under the impression that all volume is reported accurately on the major futures exchanges - sometimes too accurately with huge blocks going through on spread trades near rollover date making a mess of charts and of no interest to directional traders.

I sense some doubt in your responses about hidden and iceberg orders, which is why I asked for an official source. I realise that IB are not repsonsible for what the exchange reports, but where is the confirmation that the volume is reported by exchanges as people think it is ?

As regards UK Index futures I can give examples of major differences between broker data feeds where volume is concerned (between IB and Myttrack). OK this is not the exchange itself, but it raises the question about the validity of reported volume as received by the end-user, specifically for big orders.
And furthermore, simply because two data feeds provide differing figures does not mean that either of them are the actual correct data, or that it is in fact made available at all.
Forgive me if you think I am challenging you personally, that is not the case. I am simply trying to get the facts rather than what appear to be opinions. Given the reliance that some people place on volume in their trading decisions it is surely worthwhile to be absolutely certain about the data with which one is working.
Glenn
 
Glenn said:
I sense some doubt in your responses about hidden and iceberg orders, which is why I asked for an official source. I realise that IB are not repsonsible for what the exchange reports, but where is the confirmation that the volume is reported by exchanges as people think it is ?

Glenn
Hi Glenn. I'm sure the importance understanding how volume is reported is vital if we are to draw conclusions from it. However you seem to be misunderstanding the concept of iceberg and hidden orders, or are confusing orders with volume.

A hidden order is one that is held on (IB's say) servers and not transmitted to the exchange until the limit price is reached, and thus does not show up on the exchange order book. When the price is reached the order is then sent and filled immediately, and the volume is then reported.

An iceberg order is when one instructs one's broker to present (using the earlier example) 200 shares to the market as a limit order. As soon as that order is filled (and the volume reported by the exchange), the instruction to the broker is to present another block of 200 shares .....and so on until the 5000 you originally wanted rid of have all gone or the price has wandered away leaving you with a partial fill.

In neither of these cases is there any reason to suspect that the exchange would not report the volume, indeed the exchange has no knowledge of the precise instructions you gave the broker, it is just filling orders as they arrive from the broker.
 
Glenn said:
I sense some doubt in your responses about hidden and iceberg orders, which is why I asked for an official source. I realise that IB are not repsonsible for what the exchange reports, but where is the confirmation that the volume is reported by exchanges as people think it is ?

As regards UK Index futures I can give examples of major differences between broker data feeds where volume is concerned (between IB and Myttrack). OK this is not the exchange itself, but it raises the question about the validity of reported volume as received by the end-user, specifically for big orders.
And furthermore, simply because two data feeds provide differing figures does not mean that either of them are the actual correct data, or that it is in fact made available at all.
Forgive me if you think I am challenging you personally, that is not the case. I am simply trying to get the facts rather than what appear to be opinions. Given the reliance that some people place on volume in their trading decisions it is surely worthwhile to be absolutely certain about the data with which one is working.
Glenn

The only place you'll get a definitive answer is from the exchanges. If they're not providing what they claim to be, I'm sure the FSA or SEC would interested.

I understand the IB feed fairly well. I have written my own real time charting application that uses IB feed. I regularly track a number of stock index futures from Asian, European and US markets (though no UK markets). Except for the Kospi futures I have not come across any cases where I believe volume to be reported wrongly. In all cases I have checked (except Kospi) volume shown in downloaded historical 1 min bars corresponds closely with 1 min bars generated by my code from the streaming real time feed. In cases I checked against various posted charts from other feeds it also looks correct.

If charting software interfaces wrongly with the IB feed, then all bets are off. IB provides a LAST_SIZE event and a cumulative VOLUME event. Charting software must use the latter to calculate bar volume. In a slow market using LAST_SIZE might look OK, but it will break badly in a fast market.

Having banged on about volume, I must say I don't believe for one minute that "Volume Tells ALL", and neither do I believe that staring at a candlestick chart with volume bars is the only way to view volume.
 
Last edited:
"However you seem to be misunderstanding the concept of iceberg and hidden orders, or are confusing orders with volume."

Perhaps so, but you offer no proof either way. I am not a conspiracy theorist, just looking for facts from authoritative sources - nothing personal.

"In neither of these cases is there any reason to suspect that the exchange would not report the volume, indeed the exchange has no knowledge of the precise instructions you gave the broker, it is just filling orders as they arrive from the broker."

Ditto.

I hear what you say, and mean no disrepect to you or dcraig, but see no proof.
IMHO there is enough evidence in the UK index futures market alone to lead one to question published volume in general.
However I don't wish to round in circles and will leave it to you and others to debate or qualify if you so wish, because I'm not a major user of volume data.
Glenn
 
Dcraig,

“IMHO”. Humility is an admirable sentiment.

Thank you for the excellent references. I forgot about Market Delta. While it has been criticised in some quarters there has got to be some useful elements. The pdf Help/instruction manuals from their site constitutes an acre of forest.

Re the point of Glenn’s incomplete volume data. Whether right or wrong, we can only go off data as presented, albeit incomplete. Whether this is major or minor we’ll have to see. At least we know what we are dealing with, which is a plus.

If I see anything out of the ordinary, I’ll post it for comment.

Thanks also to peto. I didn’t understand iceberg and hidden orders.

Grant.
 
grantx said:
Dcraig,

“IMHO”. Humility is an admirable sentiment.

Thank you for the excellent references. I forgot about Market Delta. While it has been criticised in some quarters there has got to be some useful elements. The pdf Help/instruction manuals from their site constitutes an acre of forest.

Re the point of Glenn’s incomplete volume data. Whether right or wrong, we can only go off data as presented, albeit incomplete. Whether this is major or minor we’ll have to see. At least we know what we are dealing with, which is a plus.

If I see anything out of the ordinary, I’ll post it for comment.

Thanks also to peto. I didn’t understand iceberg and hidden orders.

Grant.

One further thought. Volume shows what has happened. Liquidity is a very different thing and in a sense precedes price. One measure of liquidity in futures markets is the number of contracts showing in the order book. Yes, there is faking, but a lot of it is the real deal. It can show where big players are interested in trading which is a very valuable thing to know.

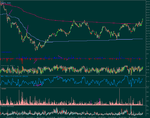
I'm attaching a chart of the DAX which I think is well worth studying in some detail. Each bar is just 5 ticks (from IB data feed - not 'real' ticks') wide which helps to show the fine structure of the market.

On this chart we have

1. Candlestick price plot. Red line is VWAP. Blue line is such that 85% of traded volume lies above it - similar to market profile lower value area.

2. Volume at ask - volume at bid (Market Delta).

3. Candlestick plot showing the ratio of number of contracts at ask in the order book to total number of contracts.

4. Smoothed representation of 3.


5. Volume.

6. Candlestick plot showing total number of contracts in the book.

There are lots of things to observe here - liquidity is not the same thing as volume, the market moves towards size, delta divergences are helpful hints, DAX traders take notice of VWAP and MP levels and more.

IMHO putting all this stuff together is the key to successful trading of stock index futures.
 

Attachments

  • dax_5ticks.png
    dax_5ticks.png
    44 KB · Views: 263
Always good to see you post dcraig. As another fan of the bolter thread I am researching along similar lines. I hope you don't mind my making a couple of suggestions and also asking an annoying question.

I don't know if you've tried splitting the delta by lot size e.g <10 and >=10 lots and also having a cumulative delta line for both groups as well as a per bar column? I've found it interesting to do this although it is too early to draw any definite conclusions. However divergences between price / cumu. delta and size / small lot traders seem to crop up regularly with some, erm, predictive power of sorts. *shiver*

I like tthe fine grain of your tick chart. In the end I settled on a volume chart instead of a time or tick chart as it made sense to me to standardise the units to volume, not number of transactions or minutes, since I felt one is studying delta which is after all a measure of volume. Apples with apples as I think someone on ET said. This also smooths the bar prints especially through lunch when there is low volume, as does a tick chart. Sometimes I flip between all types, even range bars, which can give a different perspective (or, more likely paralyse my small brain with an excess of information!).

Incidentally I changed data feed to IQfeed as, among other reasons, I was uncomfortable using IB's snapshots for delta analysis - do you find this a problem? I doubt there's actually a great deal of difference except in a fast market.

How easy is it to extract the order book info. from IB? I'm afraid I'm no programmer - the last thing I wrote was assembly language for the BBC Micro, lol - but eager to learn or trawl the right sort of online tutorial if you were kind enough to point me in the right direction. If I could get the levels into Excel for further processing / charting I would be very happy. If the answer is learn C++ then get back to me, no worries. :D

Attached is a miserably small chart of yesterday's YM with split cumulative delta. I'm not sure what to make of it but it looks like small traders kept trying to buy the dips while size wasn't interested in anything but the short side all day. On a less trendy day there tends to be more useful divergences with price: there are a couple of examples in my "YM journal", for what it's worth. e.g http://www.trade2win.com/boards/attachment.php?attachmentid=23810

I am nervous about drawingconclusions from my charts: for the moment the idea is to observe quietly for a few weeks and keep an open mind.

Anyway thanks for the DAX chart which climbs inside the market then reports back in an arresting visual form. I particularly like your work on the order book, hence my desire to try and do something similar, cheeky plagiarist that I am. I've been watching the last line of the book manually as it were for some time and would like to have it presented in a visual form.
 

Attachments

  • 2711.PNG
    2711.PNG
    60.1 KB · Views: 235
Last edited:
Hi Frugi,

Thanks for the kind words.

I had a bit of a look at splitting up delta by tick size, but I didn't really come to any conclusions. The IB feed may be a bit deficient if used for this purpose - I'm not sure. I need to spend more time on it. As you very rightly point out, it takes a lot of observation to come to any decent conclusions in this game. Eyeballing a handfull of charts doesn't cut it.

I havn't tried constant volume bars. The programming effort to add them would not be all that great, but it would take lot of testing. Every class that extends TimeSeries would have to be tested and there's lots. Alarms tested. Charts tested. UI modified etc. Not right at the moment thanks !

I've not tried data feeds other than IB, but my gut feel is that IB is probably "good enough" for delta. IB is cheap, reliable and fast and covers many international markets. I'm also trying to stay on Linux and most feeds run on Windows - even those with a Java API. One of the things I don't like about the IB feed is that you are limited to three concurrent L2 streams. I've half done integration with http://www.opentick.com but it's too unreliable to be a serious contender yet. I hope they get it sorted out as it looks very promising.

It's not especially difficult to extract L2 data from the IB feed, though it is certainly more complicated than tick data. TWS basically sends three "transactions" - inset, delete, and modify. From memory, each message has the side (bid/ask), price, size and action. You need to dynamically update a table pretty much like on on screen DOM and then you can do with it what you want. I've no idea whether you can even get L2 via the TWS DDE link. Maybe the ActiveX stuff works - I have no idea. Excel is not the best tool for this, but you might be able to get something working. BTW, I am definately not an expert in Excel.

As an aside, I think learning Java would be a much better idea than learning C++. Performance is very very good, it is substantially easier to learn and you will turn out code with fewer bugs in a shorter amount of time. I come from a C/C++/Unix background and I know that Java is not for everything but for a broad scope of problems it does the business. Sun have announced they are open sourcing Java, licensed under the GPL - the same as Linux. I think this is a very significant move attracting more developers of Java applications and more developers of core Java technologies. My crystal ball tells me that Java may become the dominant development environment outstripping .NET and everything else. It is already very important in server side and embedded devices (estimated 3 billion devices, especially phones run Java). If you want to learn Java, there are any number of books available, the tutorials on the Sun web site are quite reasonable and just Googling for anything that is proving troublesome will probably give a quick answer. You can get free, high quality Java IDEs at http://www.netbeans.org (Sun backed) and http://www.eclipse.org (IBM backed) if you want to dip your toe in the water.

I will check out your YM journal. For the US futures, I have been mostly studying ES and ER2 and I should have a look at YM. My internet connection just came back after a 53 minute outage so it's back to the grind.
 
Thank you very much for your comprehensive and useful advice, especially regarding Java. I think it may be time I learned a new language.
 
dcraig1 said:
I've no idea whether you can even get L2 via the TWS DDE link. Maybe the ActiveX stuff works - I have no idea. Excel is not the best tool for this, but you might be able to get something working. BTW, I am definately not an expert in Excel.
dcraig1 and Frugi

First - thanks for sharing some useful tips.

I can confirm that the TWS DDE link does indeed allow Excel to display this information. The sample spreadsheet they provide contains a myriad of worksheets, one of which is Market Depth. In the sample they allow up to 10 rows and it does dynamically refresh the market depth data at the refresh rate you set within the worksheet. As long as you are content with the style of their worksheets then no programming or Excel expertise is really required.

Charlton
 
Awesome! Thank you Charlton. I'm feeling rather sheepish as it turns out I've had their example spreadsheet sat on my C drive for years and never knew it was there. :eek:

Depth works perfectly. Now all need is this Excel cheat to chart it. Or better still send it to Sierrachart. Superb.

http://www.cyberxpert.com/downloads/realtimegraph_0.5.pdf

Still going to have a look at Java mind.
 
Last edited:
frugi said:
Awesome! Thank you Charlton. I'm feeling rather sheepish as it turns out I've had their example spreadsheet sat on my C drive for years and never knew it was there. :eek:

Depth works perfectly. Now all need is this Excel cheat to chart it. Or better still send it to Sierrachart. Superb.

http://www.cyberxpert.com/downloads/realtimegraph_0.5.pdf

Still going to have a look at Java mind.

Let us know if you find this a usable setup. Thanks.
 
A general question for VSA-volk.
Can anyone say from either personal experience or on the basis of something they've read or been taught what the volume relationship is (if indeed one exists) between the "stopping volume" bar and the "bottom" bar it is associated with? My preliminary impression is that the volume at the bottom is less than the stopping volume with the corollary being that if the putative bottom does not have a lesser volume then it is not the bottom but rather a new stopping volume bar.
TIA.
lj
 
Top