Volume at bid & ask

christop said:
dcraig1,

Thank you for your response and clearing many items up.

Great to see the chart.
I’d like to see it in action in our markets and the response it would create?
Do you find the same sort of patterns reoccurring as you mention and then couple these with price patterns? and other analysis etc.
I would believe you would have a higher success rate of trades too because your adding another dimension to your trade analysis, well done.

I’m wondering if anyone has attempted or written an ela (Tradestation) code for such a task.
Great work dcraig1, I can see the validity of how it assists in your trading.

I notice your in Brisbane do you trade the Aussie futures markets as well?
How much is the data feed cost from IB?

I shall continue my quest in self improvement and once again thank you for your time and assistance.

I’m always on the look-out for ways to improve trading results.

Christop

IB data feed is "freeish" - there are fees for some exchanges and not others. It is my understanding that IB just passes on what the exchange charges them.

Free: SNFE, SGX (Singapore) , KSE (Korea), HKFE (Hong Kong) and others.

US: free for stocks, options and futures if you do more than $30 commission per month. Otherwise $10

European markets (Eurex, Liffe etc): various charges.

There are some limitations:

100 instruments maximum concurrently
3 L2 streams max concurrent

The feed does not report every tick. There is a kind of aggregation with a Max of 3 - 4 updates per second. I'm of the opinion that this is not very important to most people. Some maintain they need a true tick feed, though with some exchanges doing tick aggregation themselves, just what is true tick feed is, is open to interpretation. However because of the way it works, it tends to be very fast and keep up with fast markets very well.

As for doing this sort of thing in Tradestation, I dunno. You might have to resort to writing a DLL. I don't know anything about Tradestation, so I'm not the right person to ask.

I believe that the type of pattern illustrated is typical of stock index futures. Obviously different instruments have different characteristics - volatility, liquidity etc so things are certainly going to vary. I'll try to save an SPI chart tomorrow, and post it.

I'm not especially hot on price patterns, but I like to keep the following automatically drawn on charts: floor pivots, market profile levels, developing market profile VAs, developing VWAP, previous day's VWAP. Of course one should always keep an eye on potential horizontal S/R levels. I think I prefer charts with constant volume bars - trends and channels are IMHO clearer, though time charts also convey volume info in an essential form.
 
dcraig1,

Thanks again for your response and once again clearing many things up for me in one go.

Re: Tick Feed
I use Tradestation and execute via the webiress platform or phone the broker when the net is down or when I’m in panic mode? I’ve got the panic hot key on the phone next to the trading desk.
Both webiress ($180 per month) and Tradestation (data from marketcast approx $200 per month) allow for real time tick updates, hence as a trade goes through and the chart is updated per trade per tick in real time.

What do I look at?
I keep changing as I try to develop as a trader and as I try to develop my trade plan? I’m finding this very difficult to adapt to different market conditions and as the markets change.
I’m not sure if that is good or not, sometimes I feel like I’m just hopping from method to method without perfecting any real style or trade plan.

At the moment I look at a mixture of volume bar charts and tick charts on separate screens. I use the tick charts up and close and the volume chart gives me a slightly wider view of the market.
I also flick between time charts to give me an idea of what is happening in the 5 minute, 30 minute world.
I find the time charts and volume charts good for identifying congestion. But the time based charts come unstuck during the night sessions as they are so scatty.
Once congestion is wide enough I look for the break away and then often get involved, but the secret is identifying congestion and the true breakaway when it occurs and this is still hit and miss for me.

I also look at session charts, hence the day and night sessions as a separate identity and mark fib levels and market profile POC levels, tails and single TPO’s for an idea where my price targets should be? Along side the last 3 day/night sessions lows and highs.

I’ll have to start trying to write the DLL code for Tradestation as I believe that would assist in confirming the true volume and bid support for breakouts to the upside or
break-outs away from a congestion zone ect. In doing so it would probably assist me in not taking some of the trades that don’t get a good bid support and volume on the way through and I think it is these that would probably not work as well.
If there is anyone who has attempted this I would appeciate any possible assistance and advice.

As you probably gather I’m on a quest to improve on my losers as with a higher success strike rate I believe I would be more profitable as a trader.

I look forward to seen the SPI chart in the forum.

Many thanks again and happy trading.

christop
 
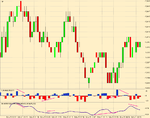
Some of today's SPI. First hour or so is missing due to some technical difficulties as they say.
 

Attachments

  • spi_25contracts.png
    spi_25contracts.png
    17.2 KB · Views: 642
dcraig1,

Thanks again. That looks great.
What volume sized chart is that?

Tradestation minimum is 100 contracts per volume bar?
That looks smaller but very good.

Thanks. You have been a great help.

Can I ask you a silly question? can you make your software only count orders great than a 10 lot order for example? As I wonder if the Column Delta and Order Book Delta would give a different perspective?
Hence my initial thoughts on only counting orders greater than the average private traders trade? I think it is the commercials we want to see, as the spi has too many hoax bids and offers and when the market gets to the price within a point or two they all start to disappear, not all the time but it does happen quiet regularly.
 
It's 25 contracts per bar - I have no limits on bar size.

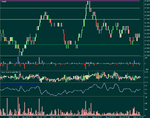
Yes I could filter by tick size - no big deal to implement. I havn't done it yet because I'm using the IB feed which aggregates, so the results would not be accurate. I can get a feel for this by using very short 'period' tick charts - not real ticks, but IB ticks, and observing bar volume. See attached SGXNK chart with bars just 5 IB ticks wide. The unsmoothed order book delta is shown as a candlestick plot on this one.

I think there is a lot to be seen on these very short period charts (not in isolation of course). In particular, the dry up of bar volume to almost nothing at turning points can often be observed.


christop said:
dcraig1,

Thanks again. That looks great.
What volume sized chart is that?

Tradestation minimum is 100 contracts per volume bar?
That looks smaller but very good.

Thanks. You have been a great help.

Can I ask you a silly question? can you make your software only count orders great than a 10 lot order for example? As I wonder if the Column Delta and Order Book Delta would give a different perspective?
Hence my initial thoughts on only counting orders greater than the average private traders trade? I think it is the commercials we want to see, as the spi has too many hoax bids and offers and when the market gets to the price within a point or two they all start to disappear, not all the time but it does happen quiet regularly.
 

Attachments

  • sgxnk_5ticks.png
    sgxnk_5ticks.png
    18.3 KB · Views: 554
Last edited:
Actually the smallest bar size when using volume bars in Tradestation is 200 contracts per bar.

I have also found the marketdelta code for Tradestation, however I can not seem to get it to work properly yet?

Any idea’s here it is:
inputs:
Threshold1( 150 ),
Threshold2( 300 ),
Threshold3( 600 ),
DisplayDelta( false ),
Type( 1 ), // 1 = Use Upticks/Downticks, 2 = Use Bid/Ask
BidAskArraySz( 1000 );

variables:
TickSize( MinMove / PriceScale ),
PriceAtIndex( Open ),
BaseIndex( BidAskArraySz/2 ),
Red1(RGB(255,185,185)),
Red2(RGB(255,128,128)),
Red3(RGB(255,0,0)),
Red4(RGB(128,0,0)),
Green1(RGB(210,255,210)),
Green2(RGB(125,255,125)),
Green3(RGB(0,255,0)),
Green4(RGB(0,128,0)),
i( 0 );

variables:
intrabarpersist Price( 0 ),
intrabarpersist MyVol( 0 ),
intrabarpersist VolTmp( 0 ),
intrabarpersist LastTick( 0 ),
intrabarpersist MyCurrentBar( 0 ),
intrabarpersist Index( 0 ),
intrabarpersist BidAskDelta( 0 ),
intrabarpersist xDelta( 0 ),
intrabarpersist TextString(""),
intrabarpersist MyUpTicks( 0 ),
intrabarpersist MyDownTicks( 0 );

Arrays:
intrabarpersist Bid[](0),
intrabarpersist Ask[](0);

Array_SetMaxIndex( Bid, BidAskArraySz );
Array_SetMaxIndex( Ask, BidAskArraySz );

if (Type = 1 or Type = 2) and LastBarOnChart and BarType < 2 then
begin
MyVol = Ticks;
PriceAtIndex = Open;

if CurrentBar > MyCurrentBar then
begin
VolTmp = 0;
MyCurrentBar = CurrentBar;
MyUpTicks = 0;
MyDownTicks = 0;

for i = 0 to BidAskArraySz - 1
begin
Bid = 0;
Ask = 0;
end;
end;

Index = BaseIndex + (Close - PriceAtIndex) / TickSize;

if InsideBid < InsideAsk then
begin
if Type = 1 then
begin
// Use Upticks/Downticks
if DownTicks <> MyDownTicks then
Bid[Index] = Bid[Index] + MyVol - VolTmp
else if UpTicks <> MyUpTicks then
Ask[Index] = Ask[Index] + MyVol - VolTmp
else
begin
if Close <= LastTick then
Bid[Index] = Bid[Index] + MyVol - VolTmp
else
Ask[Index] = Ask[Index] + MyVol - VolTmp;
end;
end
else
begin
// Use Bid/Ask
// Warning: TradeStation provides snapshot of bid/ask
if Close <= InsideBid then
Bid[Index] = Bid[Index] + MyVol - VolTmp
else if Close >= InsideAsk then
Ask[Index] = Ask[Index] + MyVol - VolTmp
else
begin
// Last tick was between bid/ask
if Close <= LastTick then
Bid[Index] = Bid[Index] + MyVol - VolTmp
else
Ask[Index] = Ask[Index] + MyVol - VolTmp;
end;
end;
end;

MyUpTicks = UpTicks;
MyDownTicks = DownTicks;
VolTmp = MyVol;
LastTick = Close;

xDelta = 0;
Price = Low;

while Price <= High
begin
Index = BaseIndex + (Price - PriceAtIndex) / TickSize;
TextString = NumToStr(Bid[Index],0) + " x " + NumToStr(Ask[Index],0);
Value99 = Text_New(Date, Time, 0, " ");
Text_SetString(Value99, TextString);
Text_SetLocation(Value99, Date, Time, Price);
Text_SetStyle(Value99, 1, 1);

BidAskDelta = Ask[Index] - Bid[Index];
if BidAskDelta > Threshold3 then
Text_SetColor(Value99, Green4)
else if BidAskDelta > Threshold2 then
Text_SetColor(Value99, Green3)
else if BidAskDelta > Threshold1 then
Text_SetColor(Value99, Green2)
else if BidAskDelta >= 0 then
Text_SetColor(Value99, Green1)
else if BidAskDelta < -Threshold3 then
Text_SetColor(Value99, Red4)
else if BidAskDelta < -Threshold2 then
Text_SetColor(Value99, Red3)
else if BidAskDelta < -Threshold1 then
Text_SetColor(Value99, Red2)
else
Text_SetColor(Value99, Red1);

xDelta = xDelta + BidAskDelta;

Price = Price + TickSize;
end;

if DisplayDelta = true then
begin
Value99 = Text_New(Date, Time, 0, " ");
Text_SetString(Value99, NumToStr(xDelta, 0 ));
Text_SetLocation(Value99, Date, Time, Low - TickSize);
Text_SetStyle(Value99, 1, 1);

if xDelta >= 0 then
Text_SetColor(Value99, Green)
else
Text_SetColor(Value99, Red);
end;
end;

Thank you all for your assistance and replies to date.
 
Top