Best Thread US day traders thread.

  • Thread starter Thread starter Naz
  • Start date Start date
  • Watchers Watchers 121
TrendTracker said:
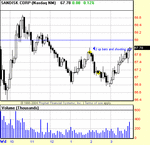
Sandisk trends nicely today... 🙂

I've started to move from position trading into daytrading and find that I'm in a need for a good level2 broker. CMC Markets does not give volume/market depth for US stocks and I find it very inconvenient. It's like wandering in a forest nearly blinded... Please, could someone recommend me a better broker.

I've read a lot of this thread on the recommendation of my good friend dvdh. It has been very valuable. Big Thanks to all those contributing to it!

Those with more experience in Level2, please help me to grasp the following. Some five years I got exited about Level2 screen that I saw a broker using but his comment was a bit off putting: "if order book was of any use we'd all be rich".

I.e. don't waste your time studying the order book. This guy was the head of research at one of the best known CFD brokers in London. Therefore I took he knew what he was talking about. But know most of you seem to reckon he was wrong and level two/order book is THE most important tool a day trader should have. Have I missed something here?

Welcome aboard, TrendTracker,
I agree this thread is a great resource, long may it continue.
FWIW my approach at the moment is to ignore level 2, (not because I think its of no use quite the opposite -traders like dvdh, MrCharts Naz, who all swear by L2, can't be wrong) and to focus on beating the odds using TA only! IF/when I can do that consistently I hope to start incorporating L2 into my trading.
I have done a lot of background homework on L2 and there appears to be two distinct camps, those who swear by it and others (who are just as successful !) who only find it marginally useful.

On a different note my starbucks break today made me miss quite a few good potential setups, typical, normally the lunch time period is flat.
 
Could it be an UP year?

Go Dow go!

SPX above 1275 is very bullish next target is 1300 on a 5 year chart !!!

The BULLS ARE RUNNING............................WATCH OUT!
 
Just from keeping the board from going stale.

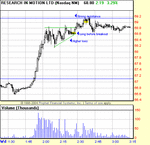
A few set ups I traded this evening.

Hope all had a good day.

Did you see RIMM and PIXR go?? Only managed the former for a good move.

All the best guys
 

Attachments

  • RIMM040106.gif
    RIMM040106.gif
    11.3 KB · Views: 290
  • SNDK040106.gif
    SNDK040106.gif
    11.3 KB · Views: 253
Failing formations / breakouts

Hello Lee,

thanks for your earlier reply and these charts as well. So the good old fashioned ascending triangles still work... I see that you want to get in early in order to avoid the pain of participating in a false break out. That implies that there are more formations that are resolved in the correct direction than those that fail. Am I correct?

In the EOD side the last year (if not last two years) have witnessed more non-traditional break outs from technical formations, ie they fail to indicate the direction of the break out more often than they used to. Based on your chart I take that this is not the case in intra-day price action.

In that shooting star situation: does the volume come into play with it? I've noticed that sometimes there are situations where a spike in a candle bar combined with heavy volume marks a turning point.

Cheers!
 
PitBull said:
Just from keeping the board from going stale.

Must admit I thought every-one must have found a new board and left me on my todd 🙂

Nice work Lee and thanks for posting.

I have had three trades this week! all losers so I won't 😱 myself by posting the set ups!
 
samtron said:
Must admit I thought every-one must have found a new board and left me on my todd 🙂

Nice work Lee and thanks for posting.

I have had three trades this week! all losers so I won't 😱 myself by posting the set ups!

Hey - you're not the only one that loses and I've noticed that even the guys who seem to win consistently don't mind posting their losses too. I've been thinking for a while about posting some losing trades, might get some feedback to confirm what went wrong.........
 
PitBull said:
Did you see RIMM and PIXR go?? Only managed the former for a good move.

All the best guys
PIXR up over $3 in 20 minutes! dvdh mentioned it to me - how did you spot it Dave?

Briefing.com had mentioned heavy put activity on options earlier on, amidst "chatter" of a takeover. Wonder if this was options traders hedging?

I thought the general rule was that price of the company doing the takeover went down and company being taken over went up, so why would the chatter generate puts? Any ideas anyone?

This is one where an alert on high volume would have got you in early enough to make a very good trade.

Some nice swings on VLO again today and bar ranges a lot less than yesterday. It was consolidating just on 55 at EOD (although dropped just under after hours) which could make it a double-top on the daily chart. Will be watching it tomorrow for sure - if it breaks 55.60/70 -ish next resistance is around 58.60 on daily chart.
 
Last edited:
TrendTracker said:
Hello Lee,

thanks for your earlier reply and these charts as well. So the good old fashioned ascending triangles still work... I see that you want to get in early in order to avoid the pain of participating in a false break out. That implies that there are more formations that are resolved in the correct direction than those that fail. Am I correct?

In the EOD side the last year (if not last two years) have witnessed more non-traditional break outs from technical formations, ie they fail to indicate the direction of the break out more often than they used to. Based on your chart I take that this is not the case in intra-day price action.

In that shooting star situation: does the volume come into play with it? I've noticed that sometimes there are situations where a spike in a candle bar combined with heavy volume marks a turning point.

Cheers!

Hi TT

If I'm understanding you correctly, a lot of breakouts fail, thats why I try to get in early. With the classic case of the triangle, there is a high probability with this set up, as in all other time frame charts with the triangle, that buying pressure is getting greater and greater and should, being the operative word, breakout. You don't always get these triangles on breakouts, but they pop up everywhere intraday. I was looking at the 5min chart and couldn't see an entry, I therefore drilled down to the 1min and hey presto, perfect low risk entry at the final trough.

The triangles that I find tricky are the symmetrical ones, these sometimes break in either direction. If it fails I immediately look for the opposite breakout.

With all these breakouts, the best ones should be in profit immediately and one should be ready to enter as soon as it takes out the highs. Don't wait the bar to form. If you miss it, wait for a pullback or drill down to shorter timeframe and wait for a pullback. The second pullbacks are the safest entry.

i couldn't tell you about whether intraday breakouts are more successful than EOD breakouts.

Yes, volume does come into the shooting star, but not as a golden rule, however the best turn arounds are after volume blow offs.

Regards
Lee
 
samtron said:
I have had three trades this week! all losers so I won't 😱 myself by posting the set ups!


We learn the most from our losses. Learn to love them 😎
 
Gadgetman said:
PIXR up over $3 in 20 minutes! dvdh mentioned it to me - how did you spot it Dave?

Briefing.com had mentioned heavy put activity on options earlier on, amidst "chatter" of a takeover. Wonder if this was options traders hedging?

I thought the general rule was that price of the company doing the takeover went down and company being taken over went up, so why would the chatter generate puts? Any ideas anyone?

This is one where an alert on high volume would have got you in early enough to make a very good trade.

Some nice swings on VLO again today and bar ranges a lot less than yesterday. It was consolidating just on 55 at EOD (although dropped just under after hours) which could make it a double-top on the daily chart. Will be watching it tomorrow for sure - if it breaks 55.60/70 -ish next resistance is around 58.60 on daily chart.

It came through briefing.com and the trade ideas scanner! Might be the option guys hedging, but also marketmakers pushing up to trigger some action I think!

-Dave.
 
TrendTracker said:
Hello Lee,

thanks for your earlier reply and these charts as well. So the good old fashioned ascending triangles still work... I see that you want to get in early in order to avoid the pain of participating in a false break out. That implies that there are more formations that are resolved in the correct direction than those that fail. Am I correct?

In the EOD side the last year (if not last two years) have witnessed more non-traditional break outs from technical formations, ie they fail to indicate the direction of the break out more often than they used to. Based on your chart I take that this is not the case in intra-day price action.

In that shooting star situation: does the volume come into play with it? I've noticed that sometimes there are situations where a spike in a candle bar combined with heavy volume marks a turning point.

Cheers!
About the spike with hevay volume! That usually is the end of that move, because marketmakers sell into all the buying! But if you know how to read the Level II screen, you'll know when to get out just before marketmakers start selling it.

-dave.
 
Gadgetman said:
You've been reading that book on Confucius again, haven't you........🙂

Another great one, very true and relevant to trading!

"It does not matter how slowly you go so long as you do not stop" 😆
 
Talking of books.......

PitBull said:
Another great one and very true!

"It does not matter how slowly you go so long as you do not stop" 😆


Based on a thread on the elitetraders board, I just got the Greg Morris book "Candlestick Charting Explained".
Absolutely superb - originally written in the 90's but is a fantastic reference for candle patterns, very easy to read, good notes on the psychology behind the patterns and even a small amount of statistics on potential success of patterns on a sample of data.

Highly recommended, it's fast becoming my "bible".
ISBN 1-55738-891-1 if anyone else interested.
 
Pixr

dvdh said:
It came through briefing.com and the trade ideas scanner! Might be the option guys hedging, but also marketmakers pushing up to trigger some action I think!

-Dave.
Note PIXR down $1.36 so far pre-market today apparently due to CSFB downgrade......
 
Today's action

I had a look through the EOD index charts and here's what I'm seeing.

We had a very clear support at 1246 and now the market is close to both a) upper end of the widening top formation and b) the price channel top. Widening tops are usually resolved down. Therefore I'd be looking to short stocks with high S&P500 correlation.

In this I'd go with Lee's view: we might well have a market top here. First I'd expect some bouncing in this range (1246 to 1280).


Comments?

market.jpg
 
Quickie ? (still learning the ropes with live trading)
How long does your platform typically take to fill your order?

I am using IB at the moment (its the one I started with) but it seems take for ages to fill, even when for example, my limit long is well above the current price (in excess of 30 seconds)?
I am only using smart routing at the moment.
You can also get into a deadly handshake where your order is accepted by the system but has not yet been actioned, if the market then moves you could get caught with your trousers down (not very nice especially at this time of year!)
I always thought L2 and Nasdaq was like grease lightening.

2 trades this afternoon 1 looser, 1 break-even 🙂
 
Samtron, I use IB too, and have not had any slow fills at all, however I only trade a maximum of 100 lots so this might be helping me! 😉 Just to let you know.
Cheers
Q
 
Quercus said:
Samtron, I use IB too, and have not had any slow fills at all, however I only trade a maximum of 100 lots so this might be helping me! 😉 Just to let you know.
Cheers
Q
Hi Q
Thanks for the feed back.
I'm only trading 100 per lot so I don't think size is the issue.
 
I'm NOT paranoid......

....I just KNOW they're all out to get me.

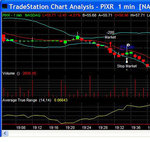
A losing trade:

Nice short on PIXR, decent trailing stop of 17 cents, somebody leaps up and grabs my nuts, then on it goes down.......

Are my stops just too tight? would be interested to know where others would have had a stop on this one.....
 

Attachments

  • pixr short.jpg
    pixr short.jpg
    83.6 KB · Views: 274
Back
Top