Best Thread US day traders thread.

As this is going to be a product marketed throughout the world then a lot of behind the scenes requirements have to be put into place.My part is ready but bear with us if its just takes a little while longer to launch.

Is there a tentative projected launch date Naz ?
 
Timaru

Thanks for that excellent piece of advice. I wouldn't of known better otherwise.
Just a few more questions if I may:

1) I take it you are using Naz's set ups? If so, are they working without Level 2?
2) Did you paper trade first?
3) Did you just take the plunge and open the account with DirectAcessElite or have you had any other experience first?
4) Did you start out with stocks priced $10-$50?

I just feel a bit nervous putting $25k capital into an account and trading live Nasdaq stocks when just starting out. Nonetheless, theres nothing like learning with real money on the line.

Your comments are very much appreciated.
Thanks guys
 
Hi timsk,
Actually I day traded LRCX twice on the day of the breakout using two of my set ups.
I also did a screen shot at the time for coaching purposes so I'll email that to you; I'm sure you'll find it interesting.
Best wishes,
Richard
 
Chicken Curry said:
Is there a tentative projected launch date Naz ?

The product covers US,UK and Forex and includes many people behind the scenes.

I'm ready but everyone and everything needs to be ready.

However i'm talking about the product in general on Nov 12th and hope someone from the company will be there as well.I shall then be demonstrating it fully on Nov19th.All details about both events can be found on the front page of www.clickevents.co.uk

Alan
 
PitBull said:
Timaru

I just feel a bit nervous putting $25k capital into an account and trading live Nasdaq stocks when just starting out. Nonetheless, theres nothing like learning with real money on the line.

Your comments are very much appreciated.
Thanks guys

Hi PitBull
I've recently spent time with both Mr. Charts and Naz, both helped a lot and each set of coaching was complementary to the other.

I paper-traded brilliantly, "making" about $3k in my first week after coaching. Decided to go with real money and what a difference that makes. I can't agree more with Timaru - emotion and slippage have been massive factors and a real challenge compared with paper trades.

You might want to factor in so many cents per share average slippage into your paper trades to give a better picture. One pleasant surprise I had was after I stopped using IB (in disgust after experiencing their "Customer Insult" service when a large chunk of my money went into Limbo for a month - another story ). Instead I have been placing trades through tthe platform I use (TradeStation) and although a week probably isn't a great representative sample the fills have been pretty good.

It's the emotional side I've struggled with and realised I have to trade real money to teach myself the proper responses to the stimuli - you'll never do that on paper (well I wouldn't anyway, it's far too detached).

I've been trading 100 shares at a time and multiplying the gains/losses by 10 on paper. That way I am still risking money and feeling the impact of that but with some safeguards. I'm sure it will be another challenge as I start to up the number of shares, next week I'll try 200 and if all goes well then go up to 500, then more.

I've learnt a heck of a lot anaylsing my trades like this over the last weeks, more so than paper trading for a longer period and realising that no matter how detached you try to be, you end up bending the rules and hey, guess what, when you do you don't make money!

Good luck
DD
 
PitBull said:
Timaru

Thanks for that excellent piece of advice. I wouldn't of known better otherwise.
Just a few more questions if I may:

1) I take it you are using Naz's set ups? If so, are they working without Level 2?
2) Did you paper trade first?
3) Did you just take the plunge and open the account with DirectAcessElite or have you had any other experience first?
4) Did you start out with stocks priced $10-$50?

I just feel a bit nervous putting $25k capital into an account and trading live Nasdaq stocks when just starting out. Nonetheless, theres nothing like learning with real money on the line.

Your comments are very much appreciated.
Thanks guys

Hi Pitbull

Sent you a PM with my answers, had a better day today (Friday), only 4 trades and $8 down. Only risked $20 per trade so was happy that had tightened up on that. Would have been in profit if sold out half position when price initially took off but hey , it's all progress, next thing to work on. Also I thought the market was a bit boring with no real action in any of the setups and stocks I was looking at.

Good Luck

AC
 
An Explanation . . .

Every once in a while a trader in his or her formative years gets an 'aha moment'. I imagine (although I don't know) that the longer one immerses oneself in the endeavour to be consistently profitable, the aha moments dwindle. Perhaps there is an inverse relationship between the number of 'aha moments' and the balance on one's trading account. Richard, Alan and others may be able to comment on this?

Anyway, the point of this is as follows. I am a wannabe day trader but circumstances are such that it is prudent for me to adopt a longer term time frame. So, for the time being at least, I'm looking at a swing trading strategy. As you might expect, this entails looking at daily, weekly and even monthly charts. In recent weeks I have posted attaching a weekly chart. Some folks might think this a little odd on a day traders thread. This is the 'aha moment'. Until moving over to a swing trading approach, 80%+ of the charts I viewed were 5 min charts. 10% or so were 10 and 15 minute charts. Once in a while I'd view a daily chart, usually of indices. Until recently, the number of times I'd looked at a weekly chart would have been few and far between over the last 3 years. The number of times I looked at a monthly chart over this period could be counted on the fingers of one hand. To paraphrase Ms. Roberts in the film Pretty Woman; 'mistake, big mistake, huge'. Alan, Richard and Co., if I'm talking from where the sun don't shine, please let me know and I'll delete the post. But, it seems to me that as day traders, there is a tendency to become absorbed by intra day detail with little awareness of the wider picture.

On this very thread Alan has talked about taking a position in a stock using a day traders entry with the view to swing trading over a period of not minutes and hours, but days. To do this successfully requires a chart with a longer term time frame in addition to, say, a 5 minute chart for the entry. Self evidently, no one would go long a stock on a 5 minute chart with the view to swing trading it over several days if the daily/weekly chart clearly indicated the stock was in a down trend.

To conclude, if you don't already do so, I recommend looking at the weekly and monthly charts - at least of your core trading stocks and certainly the indices. This broader picture may well shed additional light on what is happening in a much shorter time frame and help you to 'pull the trigger' on your day trades when others will be hesitant and to 'sit on your hands' when others are leaping over the cliff edge, like the proverbial lemmings.

(Alan & Richard - if my comments are wide of the mark and the weekly charts inappropriate for this thread - please let me know and I'll delete them accordingly).

Tim.
 
A Visual Explanation . . .

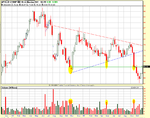
As an adjunct to my last post in which I described looking at weekly and monthly charts as an 'aha moment', I offer a weekly chart of APOL which will, I hope, provide visual reinforcement to the point I'm trying to make.

The two horizontal green lines show S & R. The degree of trading activity at these levels suggests that they are important. This is indicated by the yellow ovals on the price and the corresponding volume bars. Of the two levels, it is clear (to me, anyway!) that the $66.00 level is especially significant. If the indices remain bullish and APOL is able to consolidate its break through this level so that it then becomes support, then a move to the upside looks probable at some point. I stress at 'some point' because this maybe preceded by some horizontal work. (Just luv' that phrase). Certainly, if the break above $66.00 holds and APOL moves up to test both last Thursday and Friday's highs of $67.00, then a surge up on good volume above this level could make for a profitable day trade and, potentially, an even more profitable longer term swing trade. Doubtless it is possible to arrive at similar conclusions from just a 5 minute chart, but isn't it easier and clearer from the weekly chart?
Tim.
(Alan, Richard, if this is all boloney - please say so and I'll shut up!)
 

Attachments

  • APOL_04.11.05.PNG
    APOL_04.11.05.PNG
    47 KB · Views: 260
DD

Thanks for your reply. I like your idea of including slippage whilst paper trading. I agree that you really test yourself and your rules once money is on the line.

I'm finding time a limiting factor at the moment and will be looking to change my work hours to trade the evening session, as by the time I get home 7pm, it is sometimes too late.

How are you trading the US markets, full / part time?
 
PitBull said:
How are you trading the US markets, full / part time?

Started off swing trading, in the evenings, some months ago, then dabbled with options. I would guess like most others it's a bit of a journey finding what trading styles and strategies you're comfortable with.

My psychology appears to be more suited to intraday so, as a contractor, I had the luxury of being able to afford to break off work for a few months and try it full time, that's what I'm up to now, trading US.

Expensive 3-day courses with 20 other people are, in my opinion, good for learning the basics but you need a way to take the extra step you just won't get in those sessions. Also, what I learned in the seminars I could have easily gleaned from books, a much cheaper method!

The coaching sessions have improved my knowledge exponentially, it took me quite a while to catch on that the best way (for me) to learn was to sit one-to-one with real traders. Although their primary skills are not in training, you can glean enough to make a significant difference to the way you view and deal with the markets.

A few of weeks on, I'm breaking even which is still frustrating but can look back on even the last week's trading and realise how much I've progressed. Hopefully this week I'll start to see some return on all the investments! If not, my next (and probably final) approach, will be to spend a day with a successful trader, me commentary trading and them pointing out anything that might need correcting in my approach.

If that doesn't work, back to contracting but I really don't fancy having to put on a tie again!

Sorry for the long-winded post but I really do want to emphasise that the emotional bit plays a much larger part than you can imagine, even though everyone tells you when you start. Log your trades, do the analysis afterwards and learn from your mistakes. I've made enough mistakes so I should be a genius soon!

Good luck
DD
 
DD

Break even after a few weeks. Blimey, you are doing well! Well done.

I also believe my personality is more suited to intraday trading, but my full time job is holding me back. I need to quit this rat race and take the plunge.

Just on a general note. It would be good if there are any others out there who trade the evening session intraday, to post your trades for us wannabe evening traders to discuss, as I'm finding searching for these evening trades a bit futile.

Many thanks
 
Last edited:
Don't beleive the hype.

It's a damned sight more difficult than most let on.

JonnyT
 
PitBull said:
DD

Break even after a few weeks. Blimey, you are doing well! Well done.

Yes, but don't forget I was trading for a good few months before that and losing money. And one or good weeks isn't representative.

What with that and the cost of courses, books and coaching, plus funding my living costs from savings, it hasn't been cheap and I still don't know if I can make a living from it. I guess if I can't hack it, at least I should be able to go back to an honest job and still have the chance to supplement my income hopefully by trading. We'll see.....

DD
 
Well, good luck David. Please keep us informed of your progress. I for one would be interested to see how you get on with your trading.
 
In post 485 I showed one of my patterns.
Today the pattern cropped up yet again - one of the joys of TA.
I think it's worth looking at that post as well as this one.
The two are almost identical.
I was looking for a breach of the 27.88 level for a potential short. With the FAST trade on Thursday my micro-analysis showed imminent loss of support BEFORE it happened at the key level.
Today with MERQE there was a minor hammer on small volume, and micro-analysis showed me very strong support, NOT a weakening. This then became what I boringly call a no brainer.
In the markets I strongly believe that you disregard your opinion and act purely on the evidence, so you might look at a key level in the expectation of a potential short, but when the evidence shows a rise is highly probable, you take it and then simply manage your position on the on-going evidence in front of your eyes.
The keys for me are my TA set-ups, but with micro-analysis confirming the imminent move.
Had the situation then weakened the most I would have lost was 6c -7c so from a chart perspective that was pretty safe. In addition I would have seen the support weakening BEFORE the price fell so would probably have exited before even losing 6c.
The volume on that hammer was 33.5k.
As you can see micro-analysis forewarned me of the price rise and I stayed with it till my micro-analysis showed selling pressure growing and buying pressure abating, so I simply exited and took my money.
The up candle after the hammer was on volume of 99k but I was already in having been forewarned........
Entry 27.94
Exit 28.33
for profit +39c

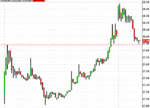
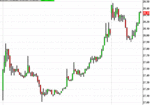
The first image is a screen dump at the time of entry, the second at the time of exit.
The third showed what happened later.
Again as can be seen, my micro-analysis showed that the rise had run its course BEFORE the chart did because price then fell - look at the third chart.
I hope someone finds this useful and interesting.
Richard
 

Attachments

  • merqelong.GIF
    merqelong.GIF
    11.1 KB · Views: 309
  • merqeexit.GIF
    merqeexit.GIF
    11.1 KB · Views: 273
  • merqewhathappenedafterwards.GIF
    merqewhathappenedafterwards.GIF
    11.8 KB · Views: 243
Thank you Richard. As always, a pleasure to read.

What alerted you to MERQ in teh first instance? Is it a core stock? Did the pattern show up on a scanner alert? Just curious.

Probably one of the hardest things in this game is picking these calls at the right time. It would be great for us newbies to discuss how you came about this move.
 
Picked up BOOM at 7pm tonight after Hammer candle @ 26.5 for 50c move, sold half at 27, stopped out other half at 27.3
 
jimmy1jag and pitbull,
You're welcome. Nice to know there are two people who found the post of value.
MERQE used to be on my core list then dropped off. It only returned when someone I was coaching last week mentioned it and I looked at it again, so thanks to him ;-)
I have a core list plus another list which changes every day. During the afternoon others usually come to my attention.
I'm glad you got something out of BOOM; it was actually on my early list but I didn't trade this evening.
Richard
 
PitBull said:
Picked up BOOM at 7pm tonight after Hammer candle @ 26.5 for 50c move, sold half at 27, stopped out other half at 27.3

high PitBull,
As one newbie to another, are you as yet using Level 2 or are you just relying on TA?
 
Top