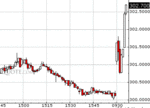
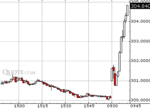
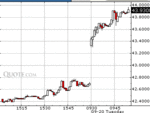
Mr. Charts said:
.......again showing the benefits of combining charts and reading the buy/sell pressures so that the swing high was anticipated - before it showed on a chart or on volume.
Inspiring stuff Mr. C!
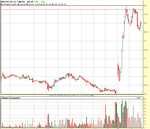
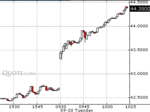
I've taken the liberty of attaching the same chart , including volume. Now, I'm very much a novice in this area but, with the benefit of hindsight, I think that volume does give some clues about where GOOG wants to go in advance of its main move. If viewed in the context of the micro-analysis that Richard describes, volume could be interpreted as a confirmation signal that here is a stock with a groundswell of buying pressure which is soon to burst at the seams. Here's my take on it . . .
GOOG opens around a dollar higher than Friday's close. The opening candle is reasonable, on good volume. This doesn't tell us anything especially interesting other than the fact that some traders may be looking to see the gap filled. Given the price of the stock and the speed at which it moves, this is a play for the hardened pro' with immaculate keying skills and a sense of timing that would make the greatest of comedians weep with envy. In spite of Naz's recent comments on this very thread, this is the time when normal people do stand aside and watch. The subsequent two candles reveal GOOG's likely intentions. Those playing the gap fill will be watching very closely and the brave amongst them will jump on board early. The lucky ones will take 50 cents or there abouts - if they get in early - placing their stops just above either the opening candle or just above the 2nd minute candle. Those who join the party late, i.e. during the third candle will have done well to exit with a scratch trade. A good many will, as I write, be telling themselves not to mess with stocks like GOOG again!
Anyway, back to the narrative. The second down candle (the third candle of the day) is on much lower volume, although it is a very strong bear candle. This is the crunch point - easy to say with 20:20 vision, I know. Nonetheless, if the gap was to be filled, it would most likely happen on the next few candles. At the same time, should it happen, many will watch to see if the $300 level is tested. Anyone who has read more than a dozen of Richard's and Alan's posts must have cottoned on to the significance that both traders place on round numbers. And they don't get much rounder than $300! Clearly, this never happened; there was no follow through to that second bear candle and the volume was dropping. The next smallish (bull) candle is especially interesting, as the volume has dropped even further.
So, to recap, by the end of candle No. 4. - this is the state of play. . .
1. The opening gap has failed to fill and there is a big question mark as to the likelihood of it doing so in the near future.
2. Of even greater significance is that there also appears to be no real selling pressure to test the $300 level.
3. Volume drops even further on the second bear candle.
4. Volume continues to fall on the fourth - now bull - candle.
What little selling pressure there was has eroded away. The very skilled who played the gap fill have made their few cents and moved on. The less skilled are licking their wounds and wondering what went wrong.
It's at this point that those traders who look for high probability trades will zero in on this stock, observing the above, confirming the story they see unfolding on their level II screens, T&S and momentum etc. Suffice to say, it's at this point that the likes of Richard and Alan take note, waiting to time their entry for a very low risk trade in a notoriously high risk stock.
Just my take on the action, which may be totally ****-eyed!
Tim.

