Trading with point and figure

Excellent calls thank you. Why dont you include the Dow more often?

here is the dow yesterday on 1 min

we can see ..break of support at about 9 am//pink horizontal
then the move down
then we get the support area/green horizontal and then a bull trap
a few bad scalps in that area for me...no complaints as you have to get kicked around occasionally.My own fault for thinking that levels would come into play...lol
i must have read about 50 people on twitter who must have got toasted ..by calling out levels

price then carried on downwards with another bull trap/marked...Did not fall for that one...

zn4obp.gif
 
take the signals ...not the levels...yesterday a good example for learning how to filter signals by changing inputs...
a few bad ones...that did not bother me
 
dow
we finally got a trend...spx charts posted up until Friday were messy
there is no sign of support ..as yet

2wf7r79.gif


test of trend from this chart 17240 and 17290 areas
 
As i keep ranting...
levels are only there as a guide....take the signals
that is why traders who call levels are of no real interest to us
 
Like you I took some bad ones yesterday, always found myself battling against the trend.

More lines: let the trend be your friend until it bends!
 
Last edited:
Analysis of Fri Dow mayhem!

With hindsight I cant see why I was trying to fight the trend, Again
its trading what I "think" will happen and not doing what the charts tell me.
Really only had two levels all day that meant anything and briefly held!
 

Attachments

  • After.png
    After.png
    41 KB · Views: 99
Last edited:
dax into the open
showing the downtrend that started friday morning

ehggnc.gif


no real sign ..yet ..of support coming in
 
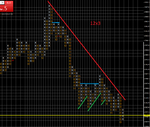
change inputs to highlight a few areas for possible areas for recoil

trend is down...bulls will get trapped..uneless massive support comes in
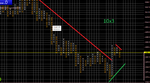
2n7lf9k.gif
/

from Friday morning
 
we either continue down and trade the bearish signals that get generated.we can then also mark new cluster areas from the new downmove
or
if it recoils we have some areas where trading signals could get generated...with test and failure or test and breakout
there are other horizontal areas which can be picked up on a candle chart
no bias when presented with a chart like that
it could easily recoil and create a new uptrend...which has some clout....that is good for us ...plenty of confusion===lots of pips

downmove was pretty sudden on Friday....so a decent recoil will create confusion and lots of pips
 
spx over last 2 weeks
we had 3 downmoves that recoiled and gave us bull traps/upside failures
This was probably leading to a sustained downmove which we got on Friday/pink
there is horizontal supp in 2004 area
 

Attachments

  • ScreenShot007.gif
    ScreenShot007.gif
    93.6 KB · Views: 78
oil/wti
latets downtrend shown
no sign of support as yet

zacud.gif

36.00 area is 50% of latest downmove
rest starts at 35.85 area
 
Last edited:
Morning all. down trend been broken now need some confirmation
 

Attachments

  • 8.15.png
    8.15.png
    30.4 KB · Views: 100
Top