Moneylender
Legendary member
- Messages
- 5,693
- Likes
- 369
has it decided what to do yet, pump or dump?
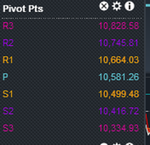
nailed emlookin like 10680 area comin
10650 first
should be a decent res in 10640 - 10660 area
has it decided what to do yet, pump or dump?
the 2050 held and we rallied2052 area needs to hold...but no real trend..just a series of moves testing supp/res
you must have got the bull move on the dow ??:clap::clap::clap:You got your 2070

that mass of horizontal supp we used to trade off yesterday afternoon/eveningspx chart just posted is completely mad
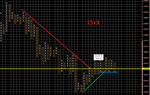
the only information we can get from that chart is
latest downmove/purple has been broken by a bullish signal yesterday near the close
there is a mass of horizontal supp/green horizontals..if they hold then we might get a minor rally
in those areas/green we might get fake bearish signals...just to complicate things
morni guvMorning all
think soPump is fav I think