Dentalfloss
Legendary member
- Messages
- 63,404
- Likes
- 3,726
still dumping...excellent
am back in
very tight stops
not sure where the recoil is ??
am back in
very tight stops
not sure where the recoil is ??

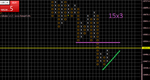
updated chart
it was a fake...
Looks a good place to have a bottom!
looks like itupdated chart
it was a fake...
Looks a good place to have a bottom!
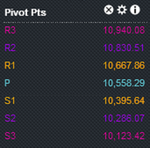
sounds goodS2 for dax is at 449 and for spx @ 2034
its 10416 for a santasounds good
Talbs rant on twitter that 10460 was the holy number....who knows
its 10416 for a santa
talk of gap fill
OkA higher volume period from 5.30 > 6.30pm on the US... maybe a bit of accumulation going on..
Plans for today
Trend into the day is up......but....
Prev supp areas now acting as res
2050 area on spx
10560 area on dax
17530 area on dow
Scenarios are
Bounce off that res when it tests and retests
Break thru and get a fake
Break thru and these areas act as support