Moneylender
Legendary member
- Messages
- 5,693
- Likes
- 369
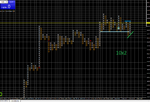
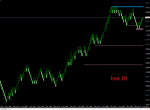
Hi Moneylender,playing with ~Renko charts as well for comparison.
The site's under attack Moneylender - we're all in the same boat. Sharky and the tech boyz are onto it - normal service will be resumed asap.Sorry guys T2W is virtually unuseable today for me, just cannot refresh at all
Sorry guys T2W is virtually unuseable today for me, just cannot refresh at all
The site's under attack Moneylender - we're all in the same boat. Sharky and the tech boyz are onto it - normal service will be resumed asap.
Tim.
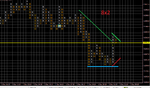
That usually means your Offline Renko chart isn't referencing the data from the 1M chart that you applied the EA to. Check that the latter is open and that the 'Allow DLL Imports' box is checked.. . . At the moment it appears to be stuck at price 11381. . .