Dentalfloss
Legendary member
- Messages
- 63,404
- Likes
- 3,726
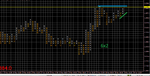
prev horizontal supp area red and green from 11350-11400...then 11400-11450
possibly 11500 to 12k on Thursday/Ecb day
possibly 11500 to 12k on Thursday/Ecb day
11340 is trend supp on 1 min
bounced from that
am i right in saying you got rinsed on a short about 11.05 am from 11388 area ??Had one shower this morning!!🙁

am i right in saying you got rinsed on a short about 11.05 am from 11388 area ??
i think you were trying to short from the red line which was prev horizontal res
yes sir11430 should the end of the bear rinse