Dentalfloss
Legendary member
- Messages
- 63,404
- Likes
- 3,726
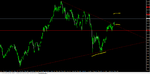
11350-11400 prev supp area on chart
50 point box size
50 point box size


its crazy in here...lolBack from the start of Xmas shopping, its crazy out there!!
hope you spent ALL those pips.....
spend the pips...dont save...its a waste of timestill got a few left lol
rinse-aid workin well....😎😎10880 we had marked..low was 10867 on Tuesday 1pm ish
high today 11367 ish
500 point move in 48 hours.....luvin it....
10880 we had marked..low was 10867 on Tuesday 1pm ish
high today 11367 ish
500 point move in 48 hours.....luvin it....
YesI bet you got most of them as well. :smart::smart::smart: