Dentalfloss
Legendary member
- Messages
- 63,404
- Likes
- 3,726
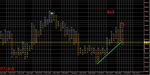
scalp shorts in from 9736 and 1932 area
tight stops
longs stopped out just before
tight stops
longs stopped out just before
worked exceptionally wellspx

approx 240 point range in that downmove from this chart
A pullback to a fib implies 50 point down
From this chart 1938 to 1950 is the 50% area
Nice rally on afriday to that area
Lets see what happens
as we said at 8.05 AMoil/wti
pulling back ??


nowt yetlooki for a signal to go short
1944-1950 poss res
gotchanowt yet
was easy stuff todayMissed your input today
was easy stuff today
res marked early on
went with the flow