Dentalfloss
Legendary member
- Messages
- 63,404
- Likes
- 3,726
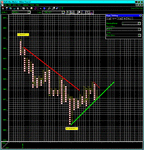
fermiisig the FOMC movea
got the trade from res after missig the move from fomcxauusd in res now
1130 prev supp area
1120 breakout area