Moneylender
Legendary member
- Messages
- 5,693
- Likes
- 369
nice charts Moneylender
been out for a great lunch...a bit too much Sauvignon...no trades afterwards


oil/wti broke the 42.50 supp at 12.30 today/here
that did not help the index
spx in a cluster area/pink horizontal
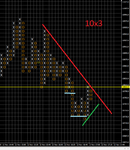
dax since 23rd october
green supp from 28th october
does it break or do we bounce ??
10710-10745 AREA