Dentalfloss
Legendary member
- Messages
- 63,404
- Likes
- 3,726
tested and bounced2073 first bull test
excellent
tested and bounced2073 first bull test
res area worked well this morningspx
updated chart

excellent movement from our res we marked10839 area horizontal res from 8th dec..not shown
10861-10883 area...prev supp area
10753-10775 area prev breakout /aqua
10689 area trend supp


scalped the bounce10764-10776 is 50% of latest upmove
time for coffee and cookies
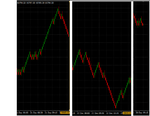
I take my hat off to anyone who can trade the Dax at the moment. If one is used to trading messy charts that tend not to have clean moves - then you could do well. To my mind, the thing I like about this instrument are the large clean momentum moves that occur most days in 'normal' market conditions. To illustrate my point, the chart below is a 10 point Renko brick showing the last two tradeable days as far as I'm concerned - the 21st and 22nd respectively - showing price action up to 11.30 am U.K. time. The third thin strip on the right is today's action - such as it is - again up to 11.30 am U.K. time. Plenty of op's in the first two charts - none to speak of in the third, IMO.Volume looks quite a bit lower than y/day, early New Year break. A little bit of US news at 3 and 3.30


