You are using an out of date browser. It may not display this or other websites correctly.
You should upgrade or use an alternative browser.
You should upgrade or use an alternative browser.
ajaskey
Well-known member
- Messages
- 281
- Likes
- 12
My Guesses
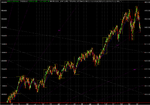
Rollover here into October. Tradeable bounce into Dec-Jan and new low in March 2008.
VST : http://ajaskey.wso.net/investor/Pix/SPX_VST_Time_GA.gif

ST : http://ajaskey.wso.net/investor/Pix/SPX_ST_Time_GA.gif

LT : http://ajaskey.wso.net/investor/Pix/SPX_LT_Time_GA.gif

Rollover here into October. Tradeable bounce into Dec-Jan and new low in March 2008.
VST : http://ajaskey.wso.net/investor/Pix/SPX_VST_Time_GA.gif

ST : http://ajaskey.wso.net/investor/Pix/SPX_ST_Time_GA.gif

LT : http://ajaskey.wso.net/investor/Pix/SPX_LT_Time_GA.gif

erierambler
Well-known member
- Messages
- 265
- Likes
- 8
Rollover here into October. Tradeable bounce into Dec-Jan and new low in March 2008.
Thanks for sharing your charts Andy......no chance of challenging the previous high first??? Thoughts?
erie
erie ,i think the spus will rally up to 1486 tonite,im offering a closing long up there and then maybe tommorrow up to 1503,one last short squeeze ,to hard to resist and the pundits can blame it on the number......heard from an indian who made a lot of money wrkin for large bank and just retired that singapore has been buying up a lot of our fannie mae debt,foriegn money just waiting to buy our debt cheap,doesnt think our economy will crap ,just dip into the open arms of these bottomfishers....might be why we havnt gone south yet..but could also mean bernank doesnt lower int rate and we sell off then,sep 18
erierambler
Well-known member
- Messages
- 265
- Likes
- 8
erie ,i think the spus will rally up to 1486 tonite,im offering a closing long up there and then maybe tommorrow up to 1503,one last short squeeze ,to hard to resist ... that might be why we havnt gone south yet..
We have a higher low and a higher high from the 16th. 🙂 It appears no followthrough to the downside from yesterday's selling yet... Buying pressure is appearing. Let's see what tommorrow brings 🙂
erie
ajaskey
Well-known member
- Messages
- 281
- Likes
- 12
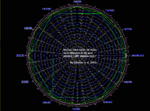
This is my MasterCycle 30 Years from october 1987.
360°=360 months 1°= 1month
0° october 1987
150° april 2000
180° october 2002
240° october 2007
Hello Celeron,
Neat picture. How do you use it?
Thanks.
celeron
Junior member
- Messages
- 18
- Likes
- 0
Hello Celeron,
Neat picture. How do you use it?
Thanks.
Hello Ajaskey,
You must refer to the Gann Theory.
The cycle begins in October 1987 and ends in October 2017.
It takes 30 years or 360 months.
Each month corresponds to a degree of the circle.
The cycle of 30 years is very important because it corresponds,
approximately, to the Saturn's orbit (1 Saturnian year = 29.457 Earth years).
According to Gann, the important time periods occur every 30 degrees or 30 months.
You can verify this personally.
Look at the points on the circle identified by the polygons: triangle, square, hexagonal, dodecagon. You will find important time periods every 30 months.
Most important is 180° or october 2002.
Very important is 120° 150° 90° 240° 270° 300° 330°.
October 2007 corresponds at 240° on the circle.
For this reason I consider very important the highest recorded in October 2007.
If you want to learn more about this, you can read here:
http://www.investireoggi.it/forum/nasdaq-composite-vp529074.html#529074
and here:
http://www.investireoggi.net/forum/immagini/1194427380masterchart1.png
the links at the thread that I lead in Italy.
If you want you can also contact me by Private Messages or e-mail.
Bye.
ajaskey
Well-known member
- Messages
- 281
- Likes
- 12
Hello Ajaskey,
You must refer to the Gann Theory.
The cycle begins in October 1987 and ends in October 2017.
Celeron,
Thanks. I knew about the cycles, but I was wondering if there were ways to use the chart that I could not get with a calendar or a spreadsheet. I've found Gann's ideas/concepts very useful, but I don't get much use from his tools for using the ideas. That picture is a lot of work to convey the concepts of the 10-10-10=30 year year cycle. The same for the square of 9. Interesting math tool, but Excel is easier. But maybe that is just me... 😆
ajaskey
Well-known member
- Messages
- 281
- Likes
- 12
Big Squareout
Two times the duration of the bear market today. Turned in Oct02, then in Apr05. Now in Oct07? Probably not, but possibly.
http://stockcharts.com/h-sc/ui?s=$SPX&p=W&st=2000-03-01&id=p54207971938&a=76385940&listNum=2

Shorter term. Squared the duration of the move from March-July at 50% price. Also, bounced off the 1x1 line from the top which it also bounced off of in mid-October.
http://stockcharts.com/h-sc/ui?s=$SPX&p=60&st=2007-03-01&id=p86948878085&a=113455169&listNum=2

Two times the duration of the bear market today. Turned in Oct02, then in Apr05. Now in Oct07? Probably not, but possibly.
http://stockcharts.com/h-sc/ui?s=$SPX&p=W&st=2000-03-01&id=p54207971938&a=76385940&listNum=2
Shorter term. Squared the duration of the move from March-July at 50% price. Also, bounced off the 1x1 line from the top which it also bounced off of in mid-October.
http://stockcharts.com/h-sc/ui?s=$SPX&p=60&st=2007-03-01&id=p86948878085&a=113455169&listNum=2
ajaskey
Well-known member
- Messages
- 281
- Likes
- 12
SPX Time vs. Price
Last up move was 212 points in 212 days. A tradeable bottom maybe be at the 25% time line.
http://ajaskey.wso.net/investor/Pix/SPX_ST_Time_GA.gif

Last up move was 212 points in 212 days. A tradeable bottom maybe be at the 25% time line.
http://ajaskey.wso.net/investor/Pix/SPX_ST_Time_GA.gif

SPX charts
Sorry guys, if this is a bit off target, but have a question..
Am looking for a charting service that offers LIVE streaming (no 15 minute delay please) of the S & P futures index. Tried to google it, but "Live Charts" always seems to offer only delayed feed. The only one I found that has possibilities is so complicated, offering so many analytical tools I don't need, that it costs over $200 per month to subscribe.
Reason - I am in South Africa. Here we can now trade the Top 40 index (called the ALSI) on the Johannesburg Stock Exchange (JSE). Some of the larger companies on the JSE are quoted on the S & P. Movement in the prices of these companies have a significant effect on movement of the ALSI, so it is really helpful to be able to watch the S & P futures index. We used to get this on the Bloomberg TV channel (which is available here via satellite), but for some reason, Bloomberg has removed this service, and now only shows the NYSE markets that are open (when they are open) and not the futures.
Thanks, if anyone has any suggestions
Alan
Have a look at http://www.quotetracker.com/index_nn.asp
Yoy will still have to pay for the data feed, but it will be a lot less than $200 per month.
Yoy will still have to pay for the data feed, but it will be a lot less than $200 per month.
Sorry guys, if this is a bit off target, but have a question..
Am looking for a charting service that offers LIVE streaming (no 15 minute delay please) of the S & P futures index. Tried to google it, but "Live Charts" always seems to offer only delayed feed. The only one I found that has possibilities is so complicated, offering so many analytical tools I don't need, that it costs over $200 per month to subscribe.
Reason - I am in South Africa. Here we can now trade the Top 40 index (called the ALSI) on the Johannesburg Stock Exchange (JSE). Some of the larger companies on the JSE are quoted on the S & P. Movement in the prices of these companies have a significant effect on movement of the ALSI, so it is really helpful to be able to watch the S & P futures index. We used to get this on the Bloomberg TV channel (which is available here via satellite), but for some reason, Bloomberg has removed this service, and now only shows the NYSE markets that are open (when they are open) and not the futures.
Thanks, if anyone has any suggestions
Alan
Similar threads
- Replies
- 36
- Views
- 14K
- Replies
- 5
- Views
- 3K


