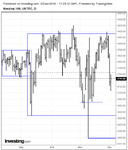
Trading the NQ

dbphoenix

Guest Author
Messages
6,954
Likes
1,266
Trading price will “work” in any auction market, i.e., any market that moves according to the law of supply and demand. However, the swings in some markets are much wilder than the swings in others. Some markets gap more than others. Some markets sit and do nothing for far longer than others, wearing out those who don’t have the patience to wait it out.

The general objective, however, is to find an instrument that is simple to trade, easy to trade, that is “directional”, that moves smoothly, that moves with ”intent” (i.e., that is decisive after reversals and breakouts), that chops as little as possible, and is, of course, liquid.

Avoiding gaps pretty much eliminates stocks. Trading outside regular market hours generally means futures. The S&P is the most popular stock-index market and the ES is therefore the most popular futures market. However, that popularity means that the S&P and the ES are the first choice of arbitrageurs. The practical consequence of this is that there will be lots of sideways movement, lots of back-and-fill, lots of congestion. For many traders, particularly small retail traders, this means scalping for ticks, and doing so alongside professionals, including HFTs, who are in a much better position to make a success of it. The small retail trader is in effect wearing a sign on his back that says “Kick Me”.

This is not to say that the ES never goes anywhere. How a particular futures instrument moves depends largely on its underlying. Dow futures are based on 30 stocks. The NQ is based on 100. The ES is based on 500. There is also the character of the underlying to consider. The NQ is essentially technology; it has for example no financials. The ES, however, incorporates nine sectors, including financials and industrials. For all these reasons the ES moves differently. Whether that difference is better or worse depends on the trader’s objectives.

When all is said and done, the more directional the instrument is, the more money there is to be made with it. Trade costs are less given that the number of trades is less due to the fact that sideways movement is less and stops are hit less frequently. And, consequently, commission costs are less. If the trader therefore finds himself resorting to scalping ticks because his instrument is yanking him around, he most likely would be better off investigating a smoother and more directional instrument, for example the NQ.
 

Attachments

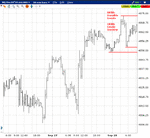
  • 09281601.gif
    09281601.gif
    30.7 KB · Views: 1,242
  • 09281602.gif
    09281602.gif
    35.3 KB · Views: 1,302
  • 09281603.gif
    09281603.gif
    39.3 KB · Views: 1,219
:|
 

Attachments

  • 09291601.gif
    09291601.gif
    31.4 KB · Views: 988
  • 09291602.gif
    09291602.gif
    42.4 KB · Views: 872
  • 09291603.gif
    09291603.gif
    28.7 KB · Views: 838
The extent to which one exercises patience is in direct relation to how well he understands what it is he's waiting for.
 

Attachments

  • 09301604.gif
    09301604.gif
    73.8 KB · Views: 854
  • 09301603.gif
    09301603.gif
    70.5 KB · Views: 916
  • 09301602.gif
    09301602.gif
    68.1 KB · Views: 853
  • 09301601.gif
    09301601.gif
    38.7 KB · Views: 896
why it's no short

Dear dbphoenix,

I'm following your posts as lurker but now have question to you regarding 09-29 example (shorting open range thrust).
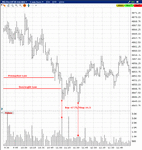
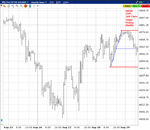
You shorted at 10.02.30 sec bar an the reason is clear. But what about 10.01.00 sec bar (attached). Is it legitimate short but stopped or invalide one?
The time scale on my chart is Moscow time zone. I also attached range bars chart to show in details.
These two situation (10.01.00 and 10.02.30) is the perfect illustration of the real problem for me. Shorting the thrust should be (IMHO) with tight stops to avoid holding position against steady continuation move. But tight stops are useful only if the timing is perfect, otherwise most trades will be stopped.
 

Attachments

  • nq0929.png
    nq0929.png
    259.6 KB · Views: 789
  • nq0929_rb.png
    nq0929_rb.png
    278.1 KB · Views: 869
Last edited:
The extent to which one exercises patience is in direct relation to how well he understands what it is he's waiting for.

dbphoenix:

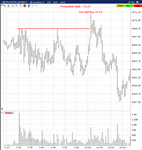
You note in your second chart in Post #3: "Pot'l Short Not Triggered". I don't think I understand why you noted this. Can you explain what you were looking for and did not see?

Was a short not triggered because price began to range after the Opening High was established?

Would a short be valid after the LH was formed (i.e. where your up/down arrow is drawn)?
 
Dear dbphoenix,

I'm following your posts as lurker but now have question to you regarding 09-29 example (shorting open range thrust).
You shorted at 10.02.30 sec bar an the reason is clear. But what about 10.01.00 sec bar (attached). Is it legitimate short but stopped or invalide one?
The time scale on my chart is Moscow time zone. I also attached range bars chart to show in details.
These two situation (10.01.00 and 10.02.30) is the perfect illustration of the real problem for me. Shorting the thrust should be (IMHO) with tight stops to avoid holding position against steady continuation move. But tight stops are useful only if the timing is perfect, otherwise most trades will be stopped.

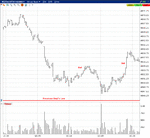
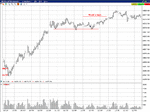
The first short is legit, but it didn't trigger my entrystop. Immediately thereafter I saw that supply was being withdrawn, which suggested that price was either going to move sideways or rally, after which it rallied. However, demand was immediately withdrawn which justified another short entry. This entrystop was triggered.
 
dbphoenix:

You note in your second chart in Post #3: "Pot'l Short Not Triggered". I don't think I understand why you noted this. Can you explain what you were looking for and did not see?

Was a short not triggered because price began to range after the Opening High was established?

Would a short be valid after the LH was formed (i.e. where your up/down arrow is drawn)?

One can't know that a LH is a LH until after it's formed. By that time one may be too late to enter, depending on his risk tolerance. That's where context and the entrystop come in.
 
I rarely use charts, but I will still follow this thread, as I am currently trading Nasdaq as my first choice for an instrument and I liked the first post as I believe it has some interesting points.
 
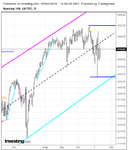
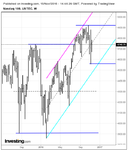
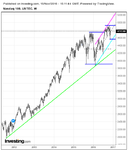
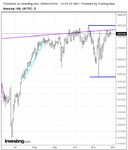
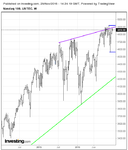
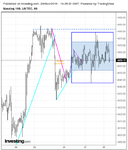
Weekly: Price around the median (pink/blue), Price also unable to continue higher after BO from TR around 3900 - 4740. But not crashing either.
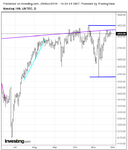
Daily: Price around median. 50%
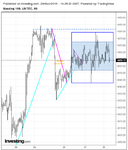
Hourly: TR (4680 - 4780), moving towards potential R.

Gringo
 

Attachments

  • NQ hourly.png
    NQ hourly.png
    28.3 KB · Views: 679
  • NQ daily.png
    NQ daily.png
    44.8 KB · Views: 786
  • NQ Weekly (2).png
    NQ Weekly (2).png
    35.7 KB · Views: 780
  • tvc_9c5f77c34fafe5e901c5a9a8d651d128.png
    tvc_9c5f77c34fafe5e901c5a9a8d651d128.png
    37.5 KB · Views: 755
Last edited:
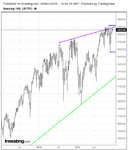
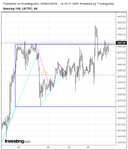
Price reached as high as 4779.12 with 4780 identified as the potential R.
 
NQ Weekly: Very close to the TR top and SL.
NQ Daily: TR top.
NQ Hourly: Ranges and medians. Graveyard for the trend follower.

Gringo
 

Attachments

  • tvc_9871f9ecb8776826998228953e1d9db2.png
    tvc_9871f9ecb8776826998228953e1d9db2.png
    32.9 KB · Views: 721
  • tvc_1c9614848d4905df36e257e3420cea2f.png
    tvc_1c9614848d4905df36e257e3420cea2f.png
    32.2 KB · Views: 729
  • tvc_30b1a8485e782f5969f4114df97e48f6.png
    tvc_30b1a8485e782f5969f4114df97e48f6.png
    37.9 KB · Views: 771
Last edited:
NQ Weekly: Very close to the TR top and SL.
NQ Daily: TR top.
NQ Hourly: Ranges and medians. Graveyard for the trend follower.

Gringo

FYI and FWIW, I haven't been concerned about channels since we began trading sideways in August. The money has been in trading the range and exploiting all the balancing that's been going on. Today, for example, provided a nice 30pt move if one understood the equilibrium process (moved up another 20pts after I posted this).
 

Attachments

  • 231882d1480429793-trading-price-tvc_9871f9ecb8776826998228953e1d9db2.png
    231882d1480429793-trading-price-tvc_9871f9ecb8776826998228953e1d9db2.png
    32.9 KB · Views: 722
  • 231884d1480429793-trading-price-tvc_1c9614848d4905df36e257e3420cea2f.png
    231884d1480429793-trading-price-tvc_1c9614848d4905df36e257e3420cea2f.png
    32.2 KB · Views: 714
  • 231886d1480429793-trading-price-tvc_30b1a8485e782f5969f4114df97e48f6.png
    231886d1480429793-trading-price-tvc_30b1a8485e782f5969f4114df97e48f6.png
    37.9 KB · Views: 711
Last edited:
NQ hourly

NQ horly:

"Livin' on the edge
You can't help yourself from fallin'
Livin' on the edge
You can't help yourself from fallin
'

--Aerosmith

Even Aerosmith was a avid fan of Wyckoff. This of course doesn't mean we know the future. We react to what we've planned in advance based on what the price does. If it goes up we follow the plan. If it goes down we follow the plan.

Gringo
 

Attachments

  • tvc_793aacb7a510418b1fc506bb47aa48ae.png
    tvc_793aacb7a510418b1fc506bb47aa48ae.png
    39.8 KB · Views: 729
Last edited:
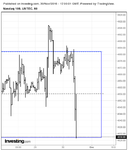
NQ is at the other end of the TR. Downward BO or reversal?
 

Attachments

  • tvc_5651338d1aba0b2b9c5bac084c3c8afa.png
    tvc_5651338d1aba0b2b9c5bac084c3c8afa.png
    30.5 KB · Views: 760
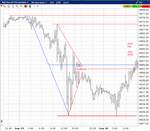
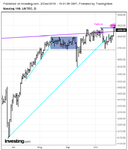
FWIW, I take a broader view, off the daily, beginning with the first decline after the break of the stride, followed by the first rally, i.e., 4625 to 4892. This provides the frame for everything that occurs thereafter. I want to focus on what The Money looks at, so I'm not overly concerned with what goes on in the big middle. That thrust on Oct 25, for example, resulted in a nice decline.
 
FWIW, I take a broader view, off the daily, beginning with the first decline after the break of the stride, followed by the first rally, i.e., 4625 to 4892. This provides the frame for everything that occurs thereafter. I want to focus on what The Money looks at, so I'm not overly concerned with what goes on in the big middle. That thrust on Oct 25, for example, resulted in a nice decline.

Is that what you are talking about?
 

Attachments

  • tvc_9c176164138a74d6d98767cf7df54158.png
    tvc_9c176164138a74d6d98767cf7df54158.png
    36.9 KB · Views: 493
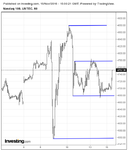
No. For that particular period, that range is useful, but for the present, I was referring to the low on 9/12 and the high on 9/22.
 
No. For that particular period, that range is useful, but for the present, I was referring to the low on 9/12 and the high on 9/22.

More in line?
 

Attachments

  • tvc_5b55d51f41d96874868ed88c2cb55962.png
    tvc_5b55d51f41d96874868ed88c2cb55962.png
    31 KB · Views: 563
Yes. You will have noticed, I'm sure, that the market has been news-driven ever since Brexit. This is challenging. However, it should be obvious even to those who don't trade price that we've been ranging ever since, and the principles of trading price still apply. It should also be obvious that the "reasons" the trade press -- and trading forums -- gives for all this movement is mostly imaginary, e.g., the "Trump rally". Rather it's just the same old ranging trending ranging trending.
 
Top