Trading Options

Whilst a profit expectation is good to have, I suggest that if the ftse is falling like a stone when (if?) the option reaches 70/77 you will wait for what you judge at that time to be a bottom, based on TA of the situation not only for the ftse, but also the Dow, S&P500 and the Nasdaq at that time . As you don't know at which ftse level this might occur, you cannot, at this stage, determine where that will be.

Making money from the simple purchase of options is very tough - you have to be right not only about direction, but also the time scale in which the move may come. You can be right about direction and see the ftse fall 400 points, but still lose 100% of your premium if it takes until mid June to get there.

A more important question is therefore to decide how much you are prepared to see the value of the option fall in value before you cut your losses. This is what will determine how long you stay in the game as a trader, not what you might make.

Also do you have any plans to modify the strategy in any way as time and price changes? Selling Deep OTM (Out of the Money)calls when you judge the index has made a top perhaps? Selling deep OTM puts further down to add further premium to the equation? (This would be a safe strategy as it would turn the strategy into a vertical bear spread, reducing the cost but capping potential profit on a big fall). And if so - at which levels? Flexibility of thinking is really important in options trading as there is an added dimension to price (namely time) that affects both value and strategy.
 
Last edited:
Dear Roger M, I have downloaded the payoff diagram calculator from the site mentioned belov but finding it difficult using it.Which values do i need to put in?
I have visited all the sites you and TBS mentioned.They contain very useful information.Like you said it has kept me bussy.
With regards to the 3325 june put,I am thinking of waiting till 10-12 may as i have bought time and FTSE is finding it hard to break 4000 level. Your views will be appriciated.
thanks.


It is useful to have a good payoff diagram calculator. The one I use can be downloaded for free from :-

http://www.hoadley.net/options/LatestVersion.htm
 
aacharya said:
Hi Roger M, htanks for replying to the thread. Your reply is very informative. I am thinking of buying June ftse 3300 put. Any comments? Where does one get options EOD data for MetaStock?

...although I know nothing about Options etc it is something that I will be following up soon so discussion on this thread has been very informative and good read indeed...thanks Roger - as ever helpful - and all who contributed..

Metastock has got optionscope 2.1 built in with calc and chart. LIFFE data is avilable from Prestel that works with metastock....I have downloaded these for along time but never used it.....

I would be grateful if anyone could point out some good beginner's book for the subject....
 
Re: option prices, Try mybroker.co.uk for 15 min delayed index and equity options. Free to download and if you wanted to trade with them you only need to trade once a month to enable live prices, you can trade the options online. A very good company imho, with excellent telephone backup.
 
zambuck said:


I would be grateful if anyone could point out some good beginner's book for the subject....


Hi Z,

Try Options as a Strategic Investment by Lawrence MacMillan.


But be aware of what people like Alex Elder say about Options...." You need a minimum of one year of successful trdaing experience in stocks or futures before touching options".


HTH
 
Helenqu said:


You need a minimum of one year of successful trdaing experience in stocks or futures before touching options".

HTH

...Hi Helen, Boy

Thanks for the book ref....another in reading list...

Indeed.....after 4 years - of some VERY unsucessful trading - perhaps will do more research before taking plunge...

thanks for comments though....
 
Bank holiday over, and I see there are a few Q's to answer.

Aacharya - what problems are you having with the Hoadley calculator? I am assuming that you are comfortable with the concept of pay-off diagrams and that you can construct them on paper as second nature. If you can't - that is your next step - use the Lenny Jordan book as your bible.

For modelling the FTSE100, there is a short "fix" you need to do before using Hoadley to make it more user friendly. The data entry boxes do not cope easily with 5 digit numbers. Remember that the price needs to be input in £'s, so with the ftse being worth £10 per point, all references to the ftse 100 need to have a "0" added. e.g. ftse 3875 needs to be input as 38750. The fix in Peter Hoadley's own words is as follows :-

******************

There have been no changes to the options strategy evaluation model that I know of although field sizes have been adjusted slightly to accommodate larger date formats -- I've checked the old version and I get exactly the same results on both. A zoom of 85% or 80% shows ##### in the strike on both versions. And 75% displays the strike OK but the graph horizontal axis is on an angle and hard to read. The axis is not on an angle at 80% or
above. I've tested this on Excel 2002. It is possible that different video cards could cause slight display differences however.

The field sizes are by design: I've had to make the fields the sizes that they are to fit everything in on the most commonly used screen resolutions and I'm aware that it won't handle some underlyings, like some indexes.

The fix is for you to adjust the field sizes to whatever suits. To do this run the macro PODUnprotect (you will find this under tools/macros). Thiswill unprotect the worksheet. Then change the Excel options to show row and column headings. You will then be able to adjust column width, change font sizes and decimal places for the payoff diagram axis etc. etc. You can then protect the sheet again by running the PODProtect macro, or by simply
changing the selection in the "show stock price as" group box.

*******************

I can confirm that this sorts the problem of ###### appearing in the strike price boxes at some resolutions.

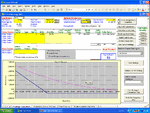
I have shown the diagram of your own position below.

Enter 38200 in the stock price box (top left)

Enter the deal-date and expiry dates where shown (top centre).

Enter 38250 in the "price in centre" box and 500 as the graph increment.

In the option trades table, enter the put details as shown, leaving volatility blank as this will be calculated for you.

Click Trade 1 in the "Calc implied volatility " box.

You should now have a pay-off diagram of your position. Cycle thru time to expiration to show the position for any date between deal date and expiration.

The on-line tutorials are excellent - I strongly recommend you work thru them all, and some of them several times.

When choosing the graph increment, select one that will occur at all the strike prices selected. e.g. do not choose 400, as this will not coincide with strike prices.

Aacharya - I cannot comment on whether your current long put strategy is good, bad or indifferent. It depends on your outlook for the ftse100 The attached pay-off diagram shows the position today. - i.e. that the ftse would need to be below 3775 today for it to go into profit, and this level will fall on a daily basis until the ftse needs to be below 3280 at expiry for there to be a profit. So it will become progressively harder to make a profit as time-value of the position decays. This is fine for option sellers, but not for option buyers. Fine if you expect a big move soon, but likely to expire worthless if the move is delayed, or if only a small to medium sized move occurs.

Finally, I agree that you should not be trading options until you have been trading shares successfully for at least 12 months, and preferably longer, particularly if you are also "writing" options. I have written about option trading for those who are ready to do it, and for those who would find this style of trading suits their lifestyle and mental approach. It is not for everyone! For newcomers, an extended period of paper-trading is recommended before you go "live"

HTH
 

Attachments

  • june put 03.gif
    june put 03.gif
    75.4 KB · Views: 1,135
Options Education

glad to see someone else advocates a bit of education-21stcenturyinvestor.com is a fantastic resource-they continue to send me free and intelligent comment.I'm always keen to hear from fellow options traders,and meet on a Thursday near Staines with 3 fellow traders.Guy Cohen's book and wbsite-linked from liffe also v.good Cheers.
 
Thanks Terrapin1. Does anyone know of ways of storing uk equity and indices options for future reference?
 
aacharya LIFE will sell you historical data on CD rom,every website around will give historic share prices(they are very keen to sell shares)Motley Fool is ok,have you tried ADVFN? I have to confess to using a big black book,and a pen for keeping records,and use an online calculator for the Greeks-not very scientific but it's a good discipline,and helps jog the memory.Happy trading,The Terrapin
 
Dear Roger and others,
I want to Sell FTSE Sept call of 100p.Is it better to sell ONE 100 or TWO 50 ? I am holding Sept 3725 put of 100.
 
go to ivolatility.com
go to free calculator,ensure it's happy with indexes by first punching in spx, and check out the Greeks-watch out for the interest and divi defaulting to US levels-I use 3.0% for divi on ftse.Enjoy
 
aarcharya - from what you say, it would seem that you have paid 100 for a Sept 3725 put and that you want to pay for it by selling calls, thereby turning it into a short synthetic. Based on prices as I write, to get 100 you would have to sell the Sept 4225 calls, or to get 50 - the Sept 4375 calls. The implied volatility of the 4225's is only 13.4% - the lowest I have ever seen, which maybe is a measure of how confident the MM's are that the price will be below this level in September. A rapid rally from here would not only put the position "into the money", but in all probability increase the volatility, and therefore the price that you would have to pay at any given level to close the position. For this to work, you have to be very confident that the FTSE will not trade significantly above 4225, and that it will trade significantly below current levels before then if you want to close it early and take your profit.

Looking at your put position, the current price for a 3725 long put is 46, with implied volatility of 25.5 - higher than the calls, which is normal, but still below recent levels. For instance, at the tail end of 2002 I was selling puts with an IV of 76% - the highest I have ever seen.

The point here is that you have to be right about both direction and time, and it would appear that you have bought the put at below current levels of the FTSE if you paid 100. Please don't take this as a criticism - I underestimated the strength of this rally as well - but your put strategy for June was incorrect on both time and direction, but at least with a long put the most you could lose was the initial premium paid. With short calls, you are exposed to unlimited loss if the ftse continues to run higher. For instance, the loss at ftse 4375 on expiry is £1500 per contract on a single 4225 short call, although you still keep the £1000 premium taken for selling it, but that was used to buy the put which would of course expire worthless. If you raise the 100 by selling 2 x 4375's for 51 each, then you have a bit more room for the FTSE to move against you, and with the ftse at 4375 on expiry, both the calls and the put would expire without value - a break-even position overall, and with potential unlimited profit below 3725. Above 4375, the position goes wrong at twice the rate of your first position (where you sold a single 4225 call) because you have 2 short calls. So expiry at 4525 would cost you £1500 per contract (4525 - 4375 = 150), or £3000 in total.

Only you can decide how likely these 2 scenario's are, and whether you would feel comfortable with the risk. Remember that options are as much a volatility play as a directional one. Implied volatility is very low at the moment, which is backed up by the low VIX in the US, making life difficult for option writers. Volatility tends to revert to the mean, so I would expect there to be an increase in volatility in future months. This will make options more expensive, which will be great for sellers, but less so for buyers. As a rule of thumb, be a net seller of options when volatility is high, and a net buyer when volatility is low.

By selling September, you are looking a long way ahead. Time decay accelerates markedly in the final 6 weeks before expiry, and it is the time value decay that option sellers want to take advantage from. Decay over the next 6 weeks will be less marked, and may in the short term be offset by any increase in prices due to an increase in volatility.

A strategy which has a similar profit profile, but without exposure to unlimited losses on a runaway rally would be a ratio put back spread. For example, using the September series, sell 1 x 4225 put for 192, and buy 2 x 3975 puts for 95. The payoff diagram is shown below, and as you can see, you break even above 4225 as the short put expires worthless, your losses rise down to 3975 as your short put goes "into the money", and below 3975, your 2 long puts start to gain value putting you into overall profit below 3725. Maximum potential loss is £2500 if the ftse is precisely at 3975 on expiry. THIS IS NOT A RECOMMENDATION. I DO NOT HAVE THIS POSITION MYSELF. IT IS ONLY TO DEMONSTRATE A PRINCIPLE!!! With this strategy you are exchanging the potential for an unlimited loss in the event that the FTSE rises significantly further, as in the case of holding short calls, for one of a limited potential loss in the event that there is little movement in the ftse over the coming months. The current position is shown by the purple line, which will merge with the heavy blue at expiry. And you are a net buyer, as you hold 2 long puts against one short.
 

Attachments

  • sept ratio put spread.gif
    sept ratio put spread.gif
    22.4 KB · Views: 604
Last edited:
Roger M an excellent response-I am reluctant to comment on other peoples trades,but try to point people in the right direction.I TOO cannot believe this bogus Bush/Blair rally-which seems to come on the back of the FED printing dollars.That it will end in tears is beyond doubt,but the timing is anyone's guess.I normally short strangle indices,but at present cannot see any trades,due to low vix.Cheers
 
Terrapin 1 - thanks for those kind words. So it's not just me finding it difficult at the moment! I also usually write a short strangle (sell calls above the index and sell puts well below it with a view to both expiring worthless so that I keep the premium collected) around the FTSE. As markets tend to spend 1/3 the time trending and 2/3 ranging, this usually works well. But premiums on calls are so poor at the moment that you have to write the call very close to current price to take in a worthwhile premium, and I just don't think it is worth the risk at the moment. Premiums on Puts are a bit better, but with this rally so technically overstretched, there could easily be a snap back of 200 - 300 points (or more) and I don't fancy the risk profile there either. A 50% retracement, which is quite normal, would take us back over 400 to ftse 3750 without destroying the bulls case.

Aarcharya - The point about commenting on other people's trades has been raised by Terrapin 1, and it is well made. I have done so in this case because you posted details about your own trade here for all to see, and you invited comment. I hope that my response is seen as constructive and not critical. The point I am trying to make is that with option premiums at very low levels, you have chosen a very difficult time to sell short your first options, and you should understand, and not minimise, the risk. I stepped out in front of this rally twice, and each time had to react quickly to protect my position, so I can assure you that you are not alone in having underestimated the strength of this rally. I did hint at the potential for a greater than normal rally in my "Short Term Bottom in the FTSE soon" thread, although the reality has far exceeded my expectations in both time and extent which was for a new high below 4000.

http://www.trade2win.co.uk/boards/showthread.php?s=&threadid=4955

Have a good weekend all!
 
Roger(M) I doff my hat in due respect!currently my dilemma(apart from hating all pop music post 1985)is the demise of Schwab's traded options service,after Barclays have eaten them up.I like the look of ADM and ODL-any thoughts?Cheers,T1
 
Terrapin1 - Not familiar with ADM. I use ODL and MyBroker comes for free if you place one order per month online. Opening longs can be done online, as can closing longs and shorts. Opening shorts has to be done by phone. Not the cheapest around, but efficient and helpful.
 
Back
Top