"Trading Day by Day" by Chick Goslin

Thanks again for your response Chump (and Schoe). I've bought over 50 books on trading over the last few years and am now more cautious on the books i purchase. I certainly don't get sucked into the road to riches path (anymore) and those were the reasons for asking the questions you have responded to.

Cheers,
Mick
 
Mick,
this book is the road to hard work not riches although you might get them if you do the hard work.... if this book only hammers home the pluses of trade selectivity and trade management then it will pay for itself many times over !
 
I second that. Chump hits the nail on the head. Thanks for all the great reviews. I have went out of my way to tell folks about this book. I will be reviewing it on EliteTrader as well. Chick is a class act. He had helped me back in the day and he can help out most traders --no matter how well you are currently doing. The book is a gem. I believe traders deserve to know about it.

As I stated before, I do not recommend books for trading. Most trading books are pure trash. However, this is one book worthy of recommending and I actually feel quite comfortable recommending it because I know the author has integrity (at least integrity enough to pick up the phone and answer questions) and I believe every trader will pick up a few concepts from this book.

If there are any other boards out there besides this one and/or EliteTrader. Please post them or drop me a pm. Chick handled this book himself. He published it himself and the marketing is being done by him. In fact the only marketing he has done is some mailers. It is selling based on word of mouth. Those that have read it know why.

I am trying to get the word out (along with a couple of other people) and appreciate all the reviews and questions. A book this good sells on its own for the most part. I figured that I owed Chick a push or two on the boards. The book deserves it. 🙂

cheers and happy holidays

TGM
 
Okay - I've had Chick's book for over a week now and spent several hours reading through and trying to get to grips with the basic ideas. His first piece of advice is to try and clear your mind of all previous consciously and unconsciously learned behaviour and fixed beliefs about price action and such-like. Easier said than done . . . .

I am still only a third of the way thru this book and don't expect the concepts to fully sink in first time through. That said, I'm finding the principles pretty heavy going. I'm not giving anything away by saying that signals are created by 'anticipation' of changes in MACD's and trend lines. However all indicators and simply weighted as opposed to exponentially. This is fine although the future direction of these indicators is based as much on where the price was X days ago as where it is and might go today.

It puzzled me how you can make a trade based on an indicator that is as influenced by what happened several days/weeks ago as it is by recent price action? There is also a very vague point about ''margin of error'' of the indicators used. A final point would be that true ''concurrent'' periods are few and far between and, according to my interpretation, by the time you would recognise them as such the move would be well advanced and nearing a reaction.

Please understand these are just personal and initial thoughts. I would really like to discuss these issues with any other readers. Maybe this will help. Care needs to be taken not to disclose the contents although the charts used are proprietary and produced by a company independent of Chick. In any case these charts can be accessed free of charge at the providers website (see earlier in thread if interested)

So - all that said - are there any comments from fellow readers??

FN
 
Hi Fastnet. I've read the book and I must say am a bit confused by your post as I can't recall any reference to Chick using MACD or Trendlines.

All he uses are a variation on moving averages one longer term, one medium term and one short time when they all point in the same direction that market is in concurrent mode rather than crosscurrent and is trending thus a good time to enter sometimes without stops being necessary.

The theme is to keep it simple and trade with the trend. Volume is shown on the charts but I don't think he uses it much. He admits that you are trading on previous price action but states that this is the only way to make decisions as the future is unknown. It makes sense that to tip the odds in your favour a trend is more likely to continue than reverse this is the only way that it is possible to compete with large institutions and professional traders.

Let me know if anybody else interprets it differently.
 
Last edited:
Nope - you are exactly right - but these are the three lines I was referring to. (sorry)

Where I really come unstuck is in the anticipation of changes of direction based on historic prices (ie those falling off the back of the indicator) - why would the effect of these prices be useful in entering trades in the current market? In his worked examples he often refers to one of the indicators being up/down when it clearly isn't. I can only conclude they he means he 'anticipates' it being up or down based on which prices will shortly no longer contribute to the indicator.

If we were told the number of days that were included in each indicator we could 'anticipate' more accurately but since he does not disclose the details it remains rather vague. . .
 
fastnet said:
If we were told the number of days that were included in each indicator we could 'anticipate' more accurately but since he does not disclose the details it remains rather vague. . .

Concurrent moves happen all the time, it just depends what timeframe you are considering... on daily bars then of course you are going to have to wait for days between signals.

as regards the 3/10/16 lines, I thought he explained in some detail how they were made up and how they work on P26?

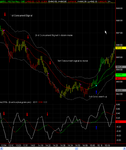
I've attached an intraday chart of the Russell2000 future from yesterday with bars coloured red for concurrent short and green for concurrent long.
 

Attachments

  • ScreenHunter_034.png
    ScreenHunter_034.png
    21.6 KB · Views: 1,433
TGM & MartinD

You two seem to be the experts in Chicks trades could you advise me on the best way to utilise this trading method on the forex markets.

Your advise would be much appreciated.

Cheers
 
fastnet said:
Nope - you are exactly right - but these are the three lines I was referring to. (sorry)

Where I really come unstuck is in the anticipation of changes of direction based on historic prices (ie those falling off the back of the indicator) - why would the effect of these prices be useful in entering trades in the current market? In his worked examples he often refers to one of the indicators being up/down when it clearly isn't. I can only conclude they he means he 'anticipates' it being up or down based on which prices will shortly no longer contribute to the indicator.

If we were told the number of days that were included in each indicator we could 'anticipate' more accurately but since he does not disclose the details it remains rather vague. . .


Hi fastnet

I also purchased a copy of this excellent book .

This may not help, but imagine a set of balance scales where you have say 25 prices on each side, as each day passes you drop 1 from the left and add 1 to the right .Assuming that each price has a weight value to it , clearly the balance will tip to up or down on the right side. Draw a horizontal line through the centre of the scales and you have a trend-line.... works for me!! .....do you see where i'm going with this idea ?

These are my own thoughts, nothing to do with the book.

counter
 
Fastnet,
Call Chick directly and ask him to help you. He can clear up your question alot quicker than I can online here. I do not have time to write a great explanation for you. But while I am here I will say this: One of the tricks/techniques he is doing is simply looking ahead by looking back to where the ML is taking off high or low numbers. You can do this with any indicator.

He simply anticipating the next trend in the middle line. By looking back to where the SL was 10-16 days ago. You can get an idea of where the price would have to close to put you into the next uptrend in the ML. You should know the construction of the lines cold (at least the ones you choose to trade with). The middle line he uses is more trendy than price (in my 10 years experience with it I agree --look at the charts left on this link). Which is odd because the Middle Line is twice removed from price. By the way, the indicator he is using in his book is an Oscillator with a moving average of itself overlaid. Or easier put a Simple Macd --not exponential. A 3/10-16 Simple Macd will get you close to SMR. So close you will not be able to tell the difference.

In the book, he anticipates the trend change by looking back 50 days (10 weeks) and looking to where the price was trading. He uses a margin of error so if you have a strong close and the downtrend is questionable. Well you should get the picture. However, feel free to call. You are a paying customer and he will be more than happy to talk with you. He can always clear any questions about his material. He always did for me.

reglenn,

Before I delve into your question, I have one of my own. Have you read the book?

TGM
 
I ordered this book after reading a book review at TSW back in March 2004. Like this thread, the reviews where so positive that I bought the book direct from http://www.tradingdaybyday.com website. The book resonates really well with the style of trading I want to do. Like many of those that have posted already about the book, I completely agree with the simple and well thought out and well described principles in this book. I really like how the examples he chooses in the book are not all happy day scenarios. He gives you a clear idea of what to look for which obviously comes from years and years of experience.

Some posters have asked how this works on FX? I primarily trade FX and I will say they work great. Because currencies are such relentless trenders, the approach described in this book will give amazing results.

A top notch book at a bargain price.
 
I have also bought the book and trade the Forex market.. however the indicators he uses on the www.smr.com web site is for the futures market. The trading hours for this appears to be different from the virtual 24/7 of the forex so how can these apply to the interbank market???
 
DESKPRO,

The indicators are not bound to one particular style of market (futures, stocks, FX etc..) - they are completely transferable. Could you elaborate for me why you believe that the trading hours affects the indicators? I don't see any problem here.
 
According to the smr web site the close price on the 17th Friday Dec for the £ was 192.88 which I assume is equivalent to 1.9288 ON FOREX but the £/$ price at the end of the 17th on forex was 1.9404 so this must have some (perhaps not as much as I think) on the indicators (for Sunday/monday)

as a aside wouldnt you get a very similar system using 3 moving averages, 50 day, 15 day and 5 day.. and stick to trading if all three or atleast two (5 and 15) are concurrent?
 
DESKPRO,

I am showing a close on 17/12 for GBP/USD of 1.9415 so I assume they are using futures prices on their site. This has no bearing on the indicators at all - use the indicators for the market you trade of course.

I have no test results to say either way....While this system does use 3 MAs, it also uses a middle line (ML) which you do not have with a 3 moving average system. The way you are using the term concurrent is not how it is described in the book. As TGM has said, understanding the ML changes how you trade dramatically. Best get the book and read it, I cannot describe the system adequately in a small post. Chick's book, all 350 pages worth does a good job.
 
TGM

"rglenn,

Before I delve into your question, I have one of my own. Have you read the book? "

I have read the book and find it very interesting and informative.

However, you have answered my question in the last post by mentioning MACD which I will investigate.

I am really trying to find out what other indicators can be utilise without subscribing to SMR's own indicators.

Cheers
 
Alternative Indicators?

Hi All,
I've also bought the book and am ploughing my way through it slowly. Like rglenn and others, I'm disinclined to subscribe to SMR. I've nothing against them, it's just something else to think about and yet more expense. I would prefer to test Chick's ideas utilising my existing data and chart provider - prophet.net in my case. I'm keen to know from others which indicators best approximate those used in SMR's charts. Is there a consensus from those who've read the book as to the three best candidates?
Tim.
 
Back
Top