wat? wat? wat? I'm doin it backwards?
rite, here is an example of a trade hypothesis.
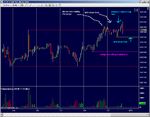
The two red lines indicate a bracket on the hourly chart, The yellow lines mark out the range we have traded around the bigger braket high.
Now, my hypothesis is written on it. first off, all the traders who shorted ((fading for the bigger range) would have their stops somewhere above the recent highs. as well, if you look at the way it traded up to it, there would be other breakout entry orders at the new highs with stops below the pullback.
So, the hypothesis was that above yesterdays high was probably an area where the market was going to go looking for liquidity. Once the breakout traders were on board and the range traders were stopped out (all buy orders, so now the market is short) the idea was then to take them out by printing below the pullback (so the bigger range is intact but the weak traders are puked out).
anyway as it happens there was not alot done up there so it was a simple auction failure / open-test-drive type trade. Anyway from lookin at the tape and seeing no trading being done I put a short in and got filled where the pink arrow is. I will look for more momentum if/when it goes to the 19s to see if there are any long stops (sell orders) here that can give the trade a bit of second wind. if not Ill probably leave it.
(actually, I don;t have an account with a ninjatrader broker, so I just did this for indicative purposes. And I'm going shopping anyway I just did id to show an example of my hypothesis trading and to gloat about my entry)


