Hi TRO
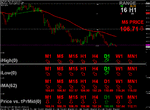
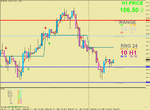
I like the _TRO_RANGE_EZ that you have displayed in the top right corner of the above screenshot. These numbers are handy to look at.
Thanks for sharing it.
Hi TRO
due to the fact that forex trades 24/5 and ccy pairs have different main trading hours due to timezone. A useful addition to this indicator IMO would be to -
Besides showing the average
H24 H1 range over the last eg. 40 days (960 candles = your default).
It would also be useful to see the average range over the last 40 days/960 candles of the
current H1 period - eg 1100-1200 HRS.
With this info, the user can get a better sense of how busy a ccy pair is at any hour of the day, rather than seeing a day as one big session.
This would just help break 24 hours down into smaller pieces of relevant information for the user IMO :idea:.
And for BUYZONE traders, this would help them identify H1 periods during th day when the conditions are less favourable for trading (when the range is shorter), and perhaps where whip-saws/none uni-directional breakouts are more likely :idea:.
For example, USDJPY ave. range is currently 24.83 based on the last 960 H1 bars. EURUSD is 22.08. This gives us the impression that USDJPY is therefore slightly better than EURUSD for trading the BUYZONE.
However, this can give us a false impression. Lets say my trding hours are 0800-1200 UK time. USDJPY 960 bar ave. range might only be 16, whereas EURUSD ave. range might be 23 between 0800-1200 UK time. Therefore, i'd actually be better off trading eurusd between 0800-1200. But the 24/5 ave. H1 stats. say that USDJPY is best overall.
While this might be the case, i think that the 24/5 ave. range strat is perhaps a little too general. Whereas for scalping, this needs to be broken down further in order to be more specific & more helpful.
Cheers
JT.

