Many traders use indicators to determine when to enter and exit trades. Most charting software includes dozens of different indicators that can be displayed on the charts. Popular indicators such as the Stochastic, and MACD, are frequently discussed when traders get together. I have listened to a number of these discussions; the interesting thing is that people typically explain why they use a particular indicator by citing a number of examples of when it has worked for them. When they do, another trader will typically say something like, ‘well it did not work for me, so I use the XYZ indicator which is much more reliable’. When I ask the second trader why his XYZ indicator is more reliable, the explanation usually involves a few more examples of good trades.
Examples do not prove anything. It is possible to flip a coin and have it come up heads five times in a row. Few traders would observe this and then think that when you flip a coin it always comes up heads. Yet for some reason people will read an article about an indicator that shows four or five examples of good trades it produced, and then they will go and risk their money trading the technique. They typically trade the new technique until it produces several losses in a row, and then they start looking for another article, that describes a ‘better’ technique, and the process repeats itself in an endless search for a better trading system.
Trading should be data driven, not based on emotion, wishful thinking, or hot tips from TV hosts. To be data driven one needs to test and analyze trading tools and find out what really works, and when each tool should be used. Traders must understand which tool to use for a specific task, and have a clear understanding of how the tool works, and what can and cannot be done with it. Traders should extensively test several trading systems and, based on the results of that testing, they develop a toolbox of different trading techniques that have shown effective results. Trading then becomes a process of selecting the most appropriate tool(s) from the trading tool box for use in the current market conditions.
As an example of the data driven trading approach we will examine the Stochastic indicator using backtesting techniques. Backtesting does not guarantee future results, nothing does and trading involves risks that may not be suitable for some. Traders should not use these, or any techniques, without fully understanding and accepting the risks involved. The information in this article is for educational purposes only, traders should check with their registered investment advisor before using trading tools or techniques to determine if they may be suitable in their specific case.
The Stochastic indicator is a widely followed indicator; but like most things in trading, using it without an understanding of how and when it works can create problems. There are no magic indicators that work all the time. One of the tricks to trading is to learn if, and when, different tools provide an edge; and then either avoid them (if they do not provide an edge), or use them in the proper market environment (if they have been shown to provide an edge). Trading blindly based on some indicator will eventually get you into trouble. Successful traders trade based on a data driven approach and an understanding of how the market and trading patterns usually behave in a given situation.
The Basic Stochastic System
The Stochastic indicator relates the current stock price to the price range over the previous twenty one days. The range is the difference between the highest and lowest prices in the last twenty one days. The Stochastic indicator is expressed as a percentage, and plotted on a scale of one to a hundred. Traditional use of this indicator indicates a buy when the Stochastic moves from below twenty to above twenty, and a sell is indicated when the Stochastic moves from above eighty to below eighty. An example of the Stochastic indicator and its use is shown in the chart below, (Fig 1: BEBE).
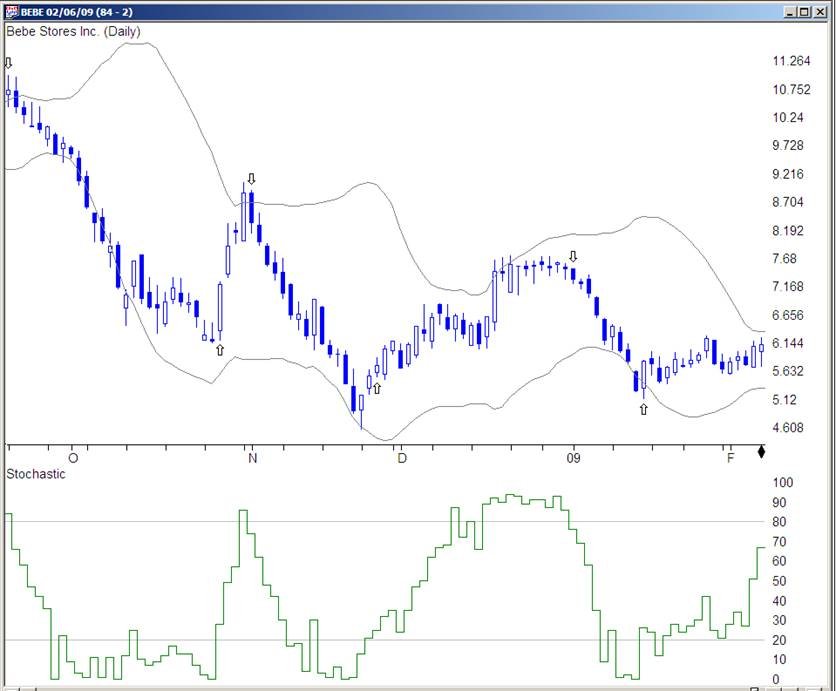
Fig 1: BEBE
In late September the Stochastic moves below 80 indicating a sell signal and BEBE starts dropping in price. In late October the Stochastic moves up above 20 indicating a buy signal, after which BEBE begins a rapid price rise. The Stochastic moves below 80 five days later indicating a sell signal. The next buy signal comes in late November and is followed by a sell signal in late December and another buy signal in mid January. All of these trades which were triggered by the Stochastic indicator moving above twenty or below eighty would have been profitable. An inexperienced trader who saw five good examples like this in a magazine article might develop an interest in the Stochastic indicator. Examples are interesting, but they prove nothing. Traders need to understand much more about an indicator than just seeing a few examples of when it works. The question of course is, “how often does this work” and, “should I risk my money based on these signals?”
In many magazine articles and books, that is all you get, just some examples of it working and then some traders just go off and start risking their hard earned money based on a few carefully selected examples. Crazy. The question is not, “Can we find a few examples of when the Stochastic indicator works”? The question of course is, “how often does this work” and, “should I risk my money based on these signals?”
In order to answer this question I first looked at all the trades made during the calendar year 2008 using the following three rules:
If the movement of the Stochastic indicator from below 20 to above 20 indicates that the stock is beginning a run, then a reasonable check on this is to buy on this signal and see if the stock is up or down five days later. We can use back testing techniques to examine a large number of Stochastic buy signals in order to determine the effectiveness of this indicator.
An example trade using the rules shown above is illustrated in the chart below, (Fig 2: CF). The Stochastic signal for CF moved from below 20 to above 20 on 07/24/08, which is noted on the chart by the up arrows. The trading rules called for an entry at the open on the next day which resulted in buying CF near 140.99. CF was held for a total of five days and then sold the following day at the open, at a price near 165.14. Following the Stochastic trading rules resulted in a net profit of about twenty four dollars in five days.
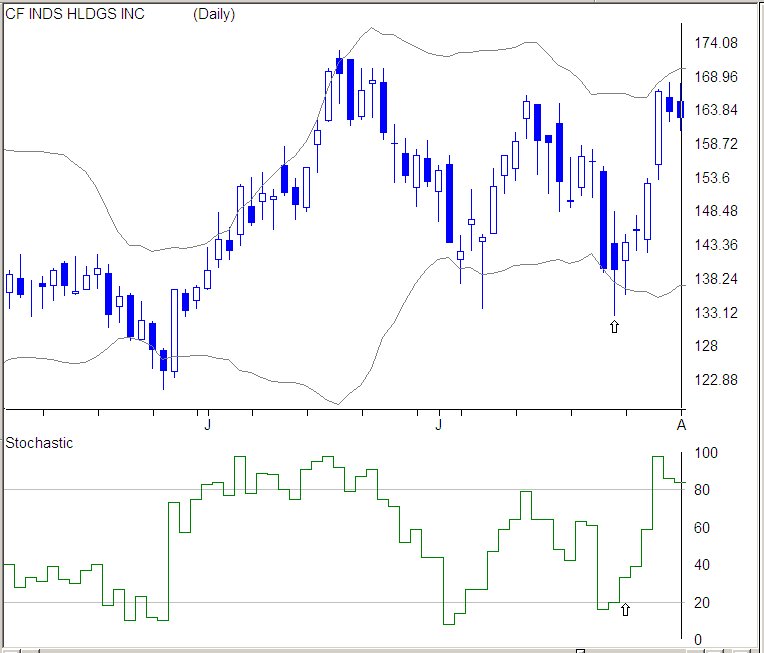
Fig 2: CF
The chart also shows that CF made a Stochastic cross in late May that would have been profitable using these trading rules, a third profitable trade resulted from another Stochastic signal in early July. Three profitable trades in a two month period is interesting. However a few examples prove nothing, so I looked at every Stochastic signal that occurred in all the stocks in my data base during calendar year 2008. The results are summarized in the table below, (Table 1: Trades in 2008).
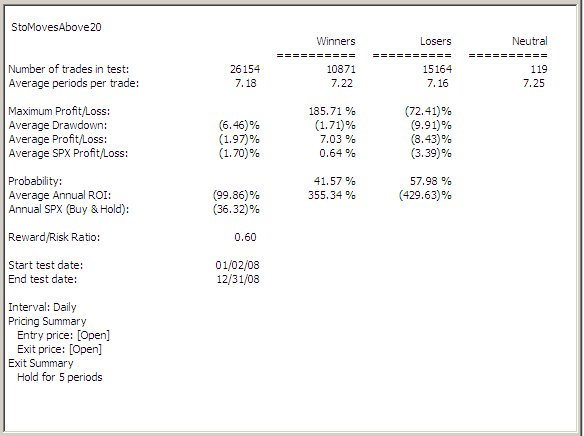
Table 1: Trades in 2008
The table shows that during 2008 there were more than twenty six thousand signals on stocks in the data base from the Stochastic indicator system noted above. That is more trades than anyone is likely to take, but the key information is that after seeing a Stochastic buy signal, only 41% of the trades were positive after five days. Trading a system that shows losing trades nearly sixty percent of the time and demonstrates an annualized loss more than double that for just buying and holding the SPX does not make much sense. Blindly using the Stochastic indicator may end up costing you money.
My data base consists of about two thousand stocks with average daily volume above 200,000 shares a day. I use this data base for testing because it is the same one I use for trading. I like to trade stocks with at least 200,000 shares average volume because the low volume stocks may have wide bid/ask spreads and may be hard to get in to or out of when the stock is moving. The 2000 stock data base provides plenty of trading opportunities, so there is no need to deal with the additional issues of low volume stocks.
2008 was a tough year for stocks, and market conditions can effect most trading systems, so I looked at all the Stochastic buy signals during the calendar year 2007. The results are shown in the table below, (Table 2: Basic Trades in 2007). There were more than twenty thousand Stochastic buy signals during calendar year 2007, but only half of them were winning trades and the annualized return of all the trades was negative. I also looked at the sixteen thousand Stochastic buy signals that occurred during 2006 and found that fifty one percent of them were winning trades. A slight annualized profit was realized, but it was less than the return for buying and holding the SPX.
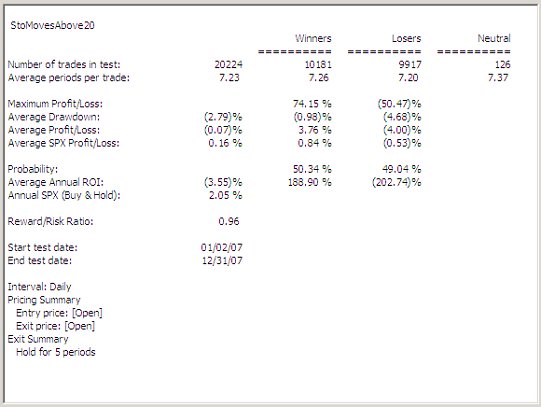
Table 2: Basic Trades in 2007
In all three years of test data for the Stochastic indicator, the buy signals resulted in poor returns, with the odds of a winning trade being equal to or less than a coin flip. After looking at the results of tens of thousands of trades over a three year period with a database of about 1,500 different stocks, it would seem that using the Stochastic indicator as a timing signal for the short term trading of stocks is questionable at best.
The interesting thing is that a lot of traders do exactly this. Some have a set of particular stocks they like and then use the Stochastic indicator to time entries. I have heard of traders that quit trading after trying this because in their opinion, ‘trading does not work’. There are people that do well at trading and they have generally carefully analyzed a trading tool or system and have a very good understanding of the statistical nature of trading and know how to use different tools in different market environments and position themselves to profit if the market or their stock setup does the normal thing in a given situation. Risking money without this information is just hoping that a system will work. Hope is an important part of life, but it is not a trading tool. It is better to clearly understand how things work rather than just get all excited after a few good examples and expect that that tool will always behave the same way. Trading without understanding how a tool has performed in different market conditions and using different parameters is an invitation to disaster.
When evaluating a trading tool or system I want to test every parameter and assumption in it, I do not want to assume anything, I want to know how every part of the definition, and the market conditions effect the results. That is data driven trading. I want to trade based on data, not assumptions. In the previous Stochastic testing we used a five day holding time. We need to see if variations around this holding time strongly effect the trading results.
I tested the effects of the holding period by running the tests using holding periods of three, five, and seven days. The results of varying the holding period during each of the three years tested are summarized in Table 3, below.
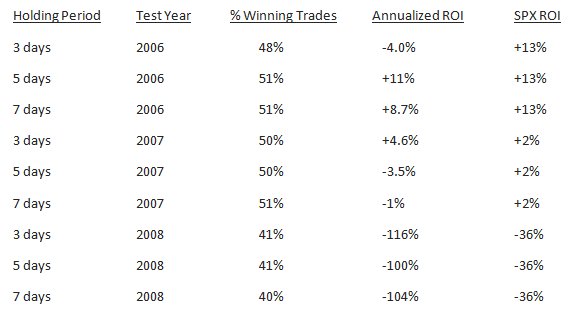
Table 3: Basic System - 3, 5 & 7 Day Holding Periods
The results shown in Table 3 indicate that for the three years tested, varying the holding time of the Stochastic buy system does not have a significant effect on results. There are a number of trading systems that show much better results than simply buying a stock when the Stochastic moves from below 20 to above 20.
A lot of traders use this technique because they have seen examples of times when it works. Of course, even a stopped clock is right twice a day. It is possible to make a few trades and get lucky by hitting several winners in a row using this technique. The tests run during 2008 show a number of trades with over thirty percent profit in just a few days, but if the system was traded regularly it was quite likely that traders using the Stochastic buy would have lost money during 2008.
Remember that trading is a statistical business. Even when the odds are just 50-50 there will be some people who are big winners. Imagine sixty four traders in a room and all are using the buy when the Stochastic moves above 20, hold for five days then sell system. All sixty four traders pick one of the many Stochastic signals on a given day and enter positions. A week later we would expect to see about thirty two traders with winning trades and the same number with losing trades. If everyone takes another trade then at the end of the second week we would expect about half of the thirty two traders picking winning trades the first week to have winning trades in the second week. Thus, after two weeks about sixteen traders have two winners in a row and everyone else has at least one loser. After the third week about eight traders would have three winners in a row, with everyone else having at least one loser. After the fourth week about four traders would have four winners in a row.
If we interview traders about the system at the end of four weeks we will find that a few have seen every trade lose money, they probably feel it is a bad system. Most of the traders have seen mixed results, and they might be willing to try it awhile longer. The four traders who have seen all their trades become profitable are likely to speak highly of the system and start making larger trades, not to mention telling all their friends what a great system it is.
If you are going to trade for a long time, and make a large number of trades over a few years, you are highly likely to see the results being along the lines of our previous analysis of thousands of trades for the Stochastic System in each of the three test years; about half will be winners and half losers. In the long run you are likely to just churn the account. Of course there will be periods where you see a number of winners in a row, just like it is possible to see four or five heads in a row when you flip a coin. Knowing what the odds of winning trades are over a large number of trades is important in understanding whether or not a trading technique is worth using. There are trading techniques that give traders an edge, the basic Stochastic signal just isn’t one of them. If you trade a system that has not been fully analyzed, you are driving with your eyes closed. You may not crash right away, but eventually you will.
One of the advantages of back testing trading systems is that you can try out different modifications and filters and see how they effect trading results. After scanning through a number of the trades made by the simple Stochastic buy signal system, I noticed that many stocks showed a number of buy signals (the Stochastic moved from below twenty to above twenty) that were relatively close together and resulted in losing trades. An example of this characteristic is shown in the chart below, (Fig 3: GOOG).
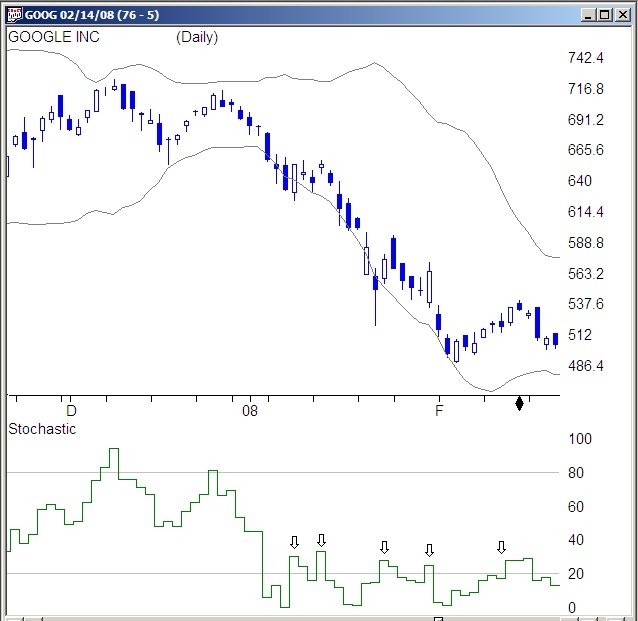
Fig 3: GOOG
There were five Stochastic buy signals relatively close together as marked by the down arrows in the chart, and each one would have resulted in a losing trade. Since there were a number of charts with these closely bunched Stochastic buy signals that showed losing trades, I wanted to see what the effect on the simple Stochastic buy system would be if I required that the system only trade Stochastic buy signals (a move from below twenty to above twenty) when the Stochastic had been below twenty for at least three weeks (fifteen consecutive days).
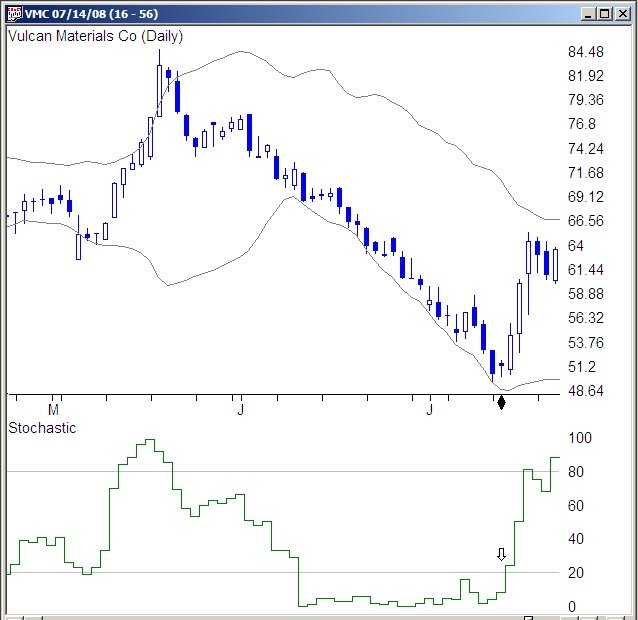
Fig 4: VMC
The next chart (Fig 4: VMC, above) shows an example of a stock where the Stochastic indicator was below twenty for at least fifteen days and then moved above twenty. The Stochastic buy signal is marked by the down arrow, and after the buy signal VMC makes a quick nine point run. The example illustrates the type of signal I am looking for, but to find out if it improves results we need to look at a large number of trades over several time periods. In the next section of this article we will clearly define this modified Stochastic trading system and look at how its test results compare to the basic Stochastic system.
The Modified Stochastic System
There were a number of observed examples of this modification to the basic Stochastic system improving results, but once again a few examples prove nothing. If you are trading based on a few examples of something working and use that technique in all market conditions, you have a very good chance of losing money. Instead of trading based on a few good examples we need to look at many trades over different market periods to determine if a tool may be useful.
The four rules for the modified Stochastic buy system are:
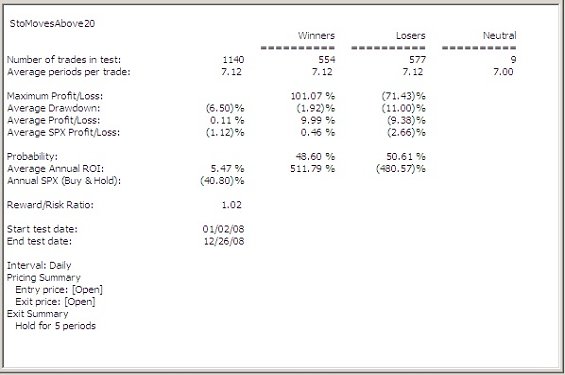
Table 4: Modified Trades in 2008
During 2008 this modified Stochastic buy system showed better results than the basic Stochastic buy system we first tested. As shown in Table 4 above, the percentage of losing trades dropped from about 58% (using the basic Stochastic technique) to slightly over fifty percent. The annualized loss of the basic Stochastic buy turned into a slight annualized profit. These numbers are a significant improvement over the basic Stochastic buy system. Buy and holding the SPX showed a significant loss during 2008 and the modified Stochastic buy system showed a slight annualized profit.
These results are interesting, so I decided to run the test of the modified Stochastic system in each of the three test years we used before and with holding periods between three and seven days. The results of this testing are shown in Table 5, below.
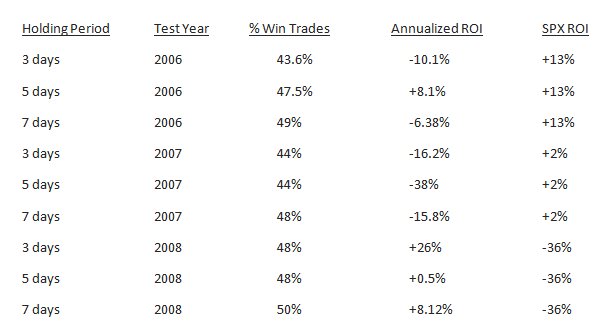
Table 5: Modified System - 3, 5 & 7 Day Holding Periods
Comparing the results shown in Table 5 which uses the modified Stochastic buy system, with the previous results shown in the standard Stochastic buy system, indicates that adding the requirement that the Stochastic be below twenty for at least fifteen days significantly improves the results for the 2008 test period. However, it decreases the results during both the 2006 and 2007 test periods. This leads us to one of the key points of trading. Annual results, or comparing results over the last one, five, or ten year period are only meaningful if you know the next year, five years, or ten year period will be just like the last one. This is rarely the case. Rather than test in time periods, which most people do, traders should test systems in market conditions. Market conditions repeat, time periods usually do not. The market can only be trending up, trending down, or moving sideways. These periods are easy to recognize and occur frequently. Knowing how a tool performs in these three different market conditions allows us to look at the market, determine the type of environment and then select the tools that have performed best in that type of environment. This is market adaptive trading. The market will not adapt to us, so we must adapt to it.
Many traders are interested in knowing how a trading system did last year, or the year before. If they see these numbers it makes them happy, and they feel that is what they should expect going forward. When some people evaluate a mutual fund or money manager, they want to know how the performance was in each of the last few years. While this seems to make people happy, it does not mean much, or give a realistic expectation of what to expect going forward. The reason is that the market is not the same from one year to the next. How the market, or a trading system, performed last year may have little to do with how it will perform next year. Looking at annual returns may be interesting, but it does not tell you how and when to use a trading tool.
I know traders who took significant losses during 2008, using techniques that showed strong results over previous years. They had developed these systems by looking at annual results over several years. When 2008 came along, and the market did not look much like it had the previous few years, they experienced losses that wiped out the profits of several years of trading. I have seen traders that are looking for the hot hand, and when they find someone with good results in the previous year, they want that person to manage all their money because they think the hot hand will perform again next year. Strong results in the past year or two may have no bearing on next year if the market conditions change.
Rather than look just at annual results, I want to know how a trading system performs in bull and bear markets. No one knows what the market will do next year. Even the ‘expert’ economists have predicted ten of the last three recessions; they are usually all over the financial channels telling you we are in a recession, or a boom period, after they have started. Few, if any, consistently predict them in advance. Driving while looking in the rear view mirror can be problematic.
The market has just three basic modes. It can be trending up, a bullish period, it can be trending down, a bearish period, or it can be just moving sideways, a trading range period. The market’s overall movement is made up of a combination of bullish, bearish, and trading range periods. Years are convenient for us to mark time, but the market does not care about them. It simply moves in combinations of bullish, bearish, and trading range. It is hard for it to do anything else.
The chart below (Fig 5: OTC) shows the 2006 through 2008 market period during which the previous testing has been done. Looking at the chart you can see that the market started 2006 in a trading range environment. After the first week in May the market transitioned to a bear market environment, and declined until the end of July. From the end of July through November the market was in a bullish mode and then went back into a trading range environment. During this three year period the market showed four bearish periods, five bullish periods, and three trading range periods. The periods vary in length, but it is hard for the market to do anything but go up, down, or mostly sideways.
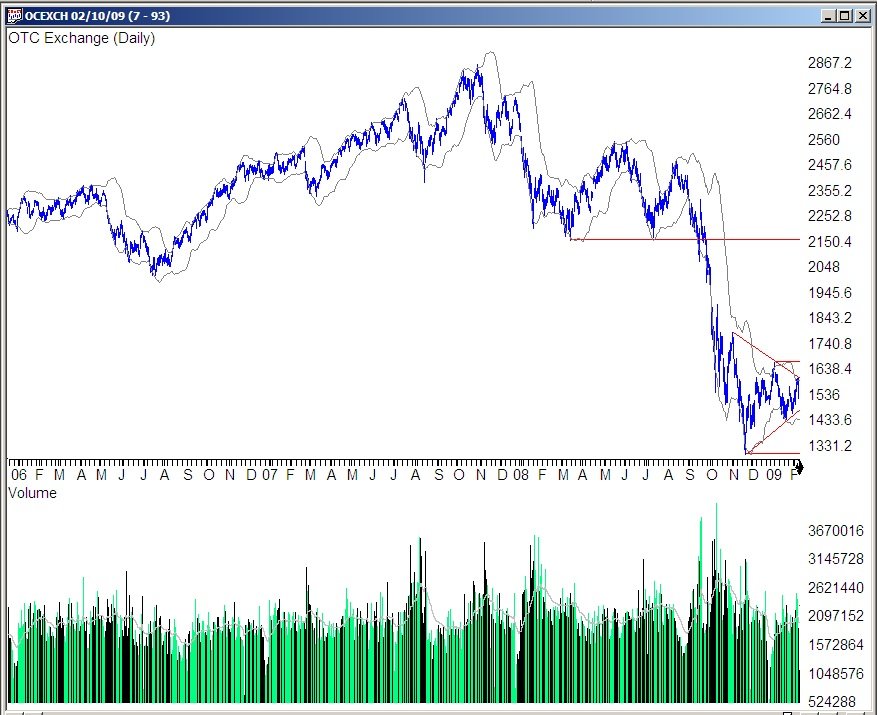
Fig 5: OTC
During the testing and evaluation of numerous trading systems I have seen that the market conditions, bullish, bearish, or trading range, have a strong effect on most systems. Because of this I have developed different trading systems for each of the three market conditions and refer to the collection of trading techniques as my trading tool box. When I see traders that are using just one tool in all market conditions, or are focused on annual results I realize that it will not be too long before they have either churned their account or see unacceptable losses. When I see a trader that has a tool box full of different techniques and picks the right one for the job I have typically found someone who has been around for awhile and knows how to trade.
The table below (Table 6: Market Types) shows the results of testing the basic Stochastic Buy indicator in bullish and bearish market conditions. Trades were taken using the basic Stochastic buy system. If the Stochastic indicator was below 20 yesterday and above 20 today then long positions were entered at the open the next day, held for five days and then sold. Trades were only taken in stocks with a twenty one day average volume of at least 200,000 shares.
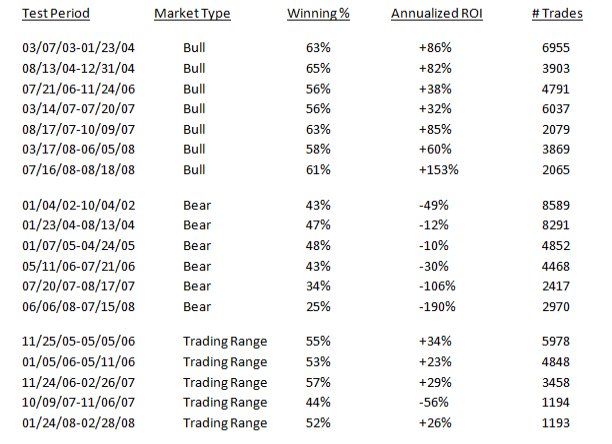
Table 6: Market Types
The data in the table gives a much clearer picture of how the basic Stochastic buy system performs than just testing it over calendar timeframes. The table shows the results of more than seventy nine thousand trades, and indicates that the basic Stochastic buy performs dramatically better during bullish market periods than it does during any of the calendar time periods tested previously. During bullish market periods the percentage of winning trades was well above random chance and it showed an attractive annualized ROI in each of the seven bullish periods tested.
During every one of the bear market periods tested in the table above, the basic Stochastic buy system showed a percentage of winning trades less than random chance, and a negative annualized ROI. The basic Stochastic buy system is not an effective trading strategy in bear market conditions. The table also shows that the basic Stochastic buy system performed fairly well during trading range periods. The results were not as strong as the results during bullish market conditions, but in four of the five trading ranges the results showed the percentage of winning trades was above random chance.
The brief analysis of the Stochastic indicator covered in this article indicates that using it all the time, as done with our annual time period testing, is likely to result in poor results. The market condition testing indicates that this is because the Stochastic indicator shows good results in bullish market periods and poor results in bearish market periods. This tool, like most trading tools has market periods where it may be effective, and market periods where it may just lose money. Effective trading requires that one have multiple tools in the trading tool box and a clear understanding when to use a specific tool and when to use another based on market condition testing.
Some of the material in this article was used with permission from Traders Library and Marketplace Books who publish two books by the author with extensive information on the development, analysis, and use of several different trading tools. For more information see: Moneymaking Candlestick Patterns and How to Take Money from the Markets Since understanding the current market condition is a critical part of knowing when to use a specific trading tool.
Steve Palmquist can be contacted by email at Steve Palmquist
Examples do not prove anything. It is possible to flip a coin and have it come up heads five times in a row. Few traders would observe this and then think that when you flip a coin it always comes up heads. Yet for some reason people will read an article about an indicator that shows four or five examples of good trades it produced, and then they will go and risk their money trading the technique. They typically trade the new technique until it produces several losses in a row, and then they start looking for another article, that describes a ‘better’ technique, and the process repeats itself in an endless search for a better trading system.
Trading should be data driven, not based on emotion, wishful thinking, or hot tips from TV hosts. To be data driven one needs to test and analyze trading tools and find out what really works, and when each tool should be used. Traders must understand which tool to use for a specific task, and have a clear understanding of how the tool works, and what can and cannot be done with it. Traders should extensively test several trading systems and, based on the results of that testing, they develop a toolbox of different trading techniques that have shown effective results. Trading then becomes a process of selecting the most appropriate tool(s) from the trading tool box for use in the current market conditions.
As an example of the data driven trading approach we will examine the Stochastic indicator using backtesting techniques. Backtesting does not guarantee future results, nothing does and trading involves risks that may not be suitable for some. Traders should not use these, or any techniques, without fully understanding and accepting the risks involved. The information in this article is for educational purposes only, traders should check with their registered investment advisor before using trading tools or techniques to determine if they may be suitable in their specific case.
The Stochastic indicator is a widely followed indicator; but like most things in trading, using it without an understanding of how and when it works can create problems. There are no magic indicators that work all the time. One of the tricks to trading is to learn if, and when, different tools provide an edge; and then either avoid them (if they do not provide an edge), or use them in the proper market environment (if they have been shown to provide an edge). Trading blindly based on some indicator will eventually get you into trouble. Successful traders trade based on a data driven approach and an understanding of how the market and trading patterns usually behave in a given situation.
The Basic Stochastic System
The Stochastic indicator relates the current stock price to the price range over the previous twenty one days. The range is the difference between the highest and lowest prices in the last twenty one days. The Stochastic indicator is expressed as a percentage, and plotted on a scale of one to a hundred. Traditional use of this indicator indicates a buy when the Stochastic moves from below twenty to above twenty, and a sell is indicated when the Stochastic moves from above eighty to below eighty. An example of the Stochastic indicator and its use is shown in the chart below, (Fig 1: BEBE).

Fig 1: BEBE
In late September the Stochastic moves below 80 indicating a sell signal and BEBE starts dropping in price. In late October the Stochastic moves up above 20 indicating a buy signal, after which BEBE begins a rapid price rise. The Stochastic moves below 80 five days later indicating a sell signal. The next buy signal comes in late November and is followed by a sell signal in late December and another buy signal in mid January. All of these trades which were triggered by the Stochastic indicator moving above twenty or below eighty would have been profitable. An inexperienced trader who saw five good examples like this in a magazine article might develop an interest in the Stochastic indicator. Examples are interesting, but they prove nothing. Traders need to understand much more about an indicator than just seeing a few examples of when it works. The question of course is, “how often does this work” and, “should I risk my money based on these signals?”
In many magazine articles and books, that is all you get, just some examples of it working and then some traders just go off and start risking their hard earned money based on a few carefully selected examples. Crazy. The question is not, “Can we find a few examples of when the Stochastic indicator works”? The question of course is, “how often does this work” and, “should I risk my money based on these signals?”
In order to answer this question I first looked at all the trades made during the calendar year 2008 using the following three rules:
- Only consider stocks for which the 21 day simple moving average of the volume is greater than 200,000.
- Buy at the open tomorrow if the Stochastic was below 20 yesterday and above 20 today.
- Hold for five days, then sell at the opening the following day.
If the movement of the Stochastic indicator from below 20 to above 20 indicates that the stock is beginning a run, then a reasonable check on this is to buy on this signal and see if the stock is up or down five days later. We can use back testing techniques to examine a large number of Stochastic buy signals in order to determine the effectiveness of this indicator.
An example trade using the rules shown above is illustrated in the chart below, (Fig 2: CF). The Stochastic signal for CF moved from below 20 to above 20 on 07/24/08, which is noted on the chart by the up arrows. The trading rules called for an entry at the open on the next day which resulted in buying CF near 140.99. CF was held for a total of five days and then sold the following day at the open, at a price near 165.14. Following the Stochastic trading rules resulted in a net profit of about twenty four dollars in five days.

Fig 2: CF
The chart also shows that CF made a Stochastic cross in late May that would have been profitable using these trading rules, a third profitable trade resulted from another Stochastic signal in early July. Three profitable trades in a two month period is interesting. However a few examples prove nothing, so I looked at every Stochastic signal that occurred in all the stocks in my data base during calendar year 2008. The results are summarized in the table below, (Table 1: Trades in 2008).

Table 1: Trades in 2008
The table shows that during 2008 there were more than twenty six thousand signals on stocks in the data base from the Stochastic indicator system noted above. That is more trades than anyone is likely to take, but the key information is that after seeing a Stochastic buy signal, only 41% of the trades were positive after five days. Trading a system that shows losing trades nearly sixty percent of the time and demonstrates an annualized loss more than double that for just buying and holding the SPX does not make much sense. Blindly using the Stochastic indicator may end up costing you money.
My data base consists of about two thousand stocks with average daily volume above 200,000 shares a day. I use this data base for testing because it is the same one I use for trading. I like to trade stocks with at least 200,000 shares average volume because the low volume stocks may have wide bid/ask spreads and may be hard to get in to or out of when the stock is moving. The 2000 stock data base provides plenty of trading opportunities, so there is no need to deal with the additional issues of low volume stocks.
2008 was a tough year for stocks, and market conditions can effect most trading systems, so I looked at all the Stochastic buy signals during the calendar year 2007. The results are shown in the table below, (Table 2: Basic Trades in 2007). There were more than twenty thousand Stochastic buy signals during calendar year 2007, but only half of them were winning trades and the annualized return of all the trades was negative. I also looked at the sixteen thousand Stochastic buy signals that occurred during 2006 and found that fifty one percent of them were winning trades. A slight annualized profit was realized, but it was less than the return for buying and holding the SPX.

Table 2: Basic Trades in 2007
In all three years of test data for the Stochastic indicator, the buy signals resulted in poor returns, with the odds of a winning trade being equal to or less than a coin flip. After looking at the results of tens of thousands of trades over a three year period with a database of about 1,500 different stocks, it would seem that using the Stochastic indicator as a timing signal for the short term trading of stocks is questionable at best.
The interesting thing is that a lot of traders do exactly this. Some have a set of particular stocks they like and then use the Stochastic indicator to time entries. I have heard of traders that quit trading after trying this because in their opinion, ‘trading does not work’. There are people that do well at trading and they have generally carefully analyzed a trading tool or system and have a very good understanding of the statistical nature of trading and know how to use different tools in different market environments and position themselves to profit if the market or their stock setup does the normal thing in a given situation. Risking money without this information is just hoping that a system will work. Hope is an important part of life, but it is not a trading tool. It is better to clearly understand how things work rather than just get all excited after a few good examples and expect that that tool will always behave the same way. Trading without understanding how a tool has performed in different market conditions and using different parameters is an invitation to disaster.
When evaluating a trading tool or system I want to test every parameter and assumption in it, I do not want to assume anything, I want to know how every part of the definition, and the market conditions effect the results. That is data driven trading. I want to trade based on data, not assumptions. In the previous Stochastic testing we used a five day holding time. We need to see if variations around this holding time strongly effect the trading results.
I tested the effects of the holding period by running the tests using holding periods of three, five, and seven days. The results of varying the holding period during each of the three years tested are summarized in Table 3, below.

Table 3: Basic System - 3, 5 & 7 Day Holding Periods
The results shown in Table 3 indicate that for the three years tested, varying the holding time of the Stochastic buy system does not have a significant effect on results. There are a number of trading systems that show much better results than simply buying a stock when the Stochastic moves from below 20 to above 20.
A lot of traders use this technique because they have seen examples of times when it works. Of course, even a stopped clock is right twice a day. It is possible to make a few trades and get lucky by hitting several winners in a row using this technique. The tests run during 2008 show a number of trades with over thirty percent profit in just a few days, but if the system was traded regularly it was quite likely that traders using the Stochastic buy would have lost money during 2008.
Remember that trading is a statistical business. Even when the odds are just 50-50 there will be some people who are big winners. Imagine sixty four traders in a room and all are using the buy when the Stochastic moves above 20, hold for five days then sell system. All sixty four traders pick one of the many Stochastic signals on a given day and enter positions. A week later we would expect to see about thirty two traders with winning trades and the same number with losing trades. If everyone takes another trade then at the end of the second week we would expect about half of the thirty two traders picking winning trades the first week to have winning trades in the second week. Thus, after two weeks about sixteen traders have two winners in a row and everyone else has at least one loser. After the third week about eight traders would have three winners in a row, with everyone else having at least one loser. After the fourth week about four traders would have four winners in a row.
If we interview traders about the system at the end of four weeks we will find that a few have seen every trade lose money, they probably feel it is a bad system. Most of the traders have seen mixed results, and they might be willing to try it awhile longer. The four traders who have seen all their trades become profitable are likely to speak highly of the system and start making larger trades, not to mention telling all their friends what a great system it is.
If you are going to trade for a long time, and make a large number of trades over a few years, you are highly likely to see the results being along the lines of our previous analysis of thousands of trades for the Stochastic System in each of the three test years; about half will be winners and half losers. In the long run you are likely to just churn the account. Of course there will be periods where you see a number of winners in a row, just like it is possible to see four or five heads in a row when you flip a coin. Knowing what the odds of winning trades are over a large number of trades is important in understanding whether or not a trading technique is worth using. There are trading techniques that give traders an edge, the basic Stochastic signal just isn’t one of them. If you trade a system that has not been fully analyzed, you are driving with your eyes closed. You may not crash right away, but eventually you will.
One of the advantages of back testing trading systems is that you can try out different modifications and filters and see how they effect trading results. After scanning through a number of the trades made by the simple Stochastic buy signal system, I noticed that many stocks showed a number of buy signals (the Stochastic moved from below twenty to above twenty) that were relatively close together and resulted in losing trades. An example of this characteristic is shown in the chart below, (Fig 3: GOOG).

Fig 3: GOOG
There were five Stochastic buy signals relatively close together as marked by the down arrows in the chart, and each one would have resulted in a losing trade. Since there were a number of charts with these closely bunched Stochastic buy signals that showed losing trades, I wanted to see what the effect on the simple Stochastic buy system would be if I required that the system only trade Stochastic buy signals (a move from below twenty to above twenty) when the Stochastic had been below twenty for at least three weeks (fifteen consecutive days).

Fig 4: VMC
The next chart (Fig 4: VMC, above) shows an example of a stock where the Stochastic indicator was below twenty for at least fifteen days and then moved above twenty. The Stochastic buy signal is marked by the down arrow, and after the buy signal VMC makes a quick nine point run. The example illustrates the type of signal I am looking for, but to find out if it improves results we need to look at a large number of trades over several time periods. In the next section of this article we will clearly define this modified Stochastic trading system and look at how its test results compare to the basic Stochastic system.
The Modified Stochastic System
There were a number of observed examples of this modification to the basic Stochastic system improving results, but once again a few examples prove nothing. If you are trading based on a few examples of something working and use that technique in all market conditions, you have a very good chance of losing money. Instead of trading based on a few good examples we need to look at many trades over different market periods to determine if a tool may be useful.
The four rules for the modified Stochastic buy system are:
- Only consider stocks for which the Stochastic indicator has been below fifteen for each of the last fifteen days.
- Only consider stocks for which the 21 day simple moving average of the volume is greater than 200,000.
- Buy at the open tomorrow if the Stochastic was below 20 yesterday and above 20 today.
- Hold for five days then sell at the opening the following day.

Table 4: Modified Trades in 2008
During 2008 this modified Stochastic buy system showed better results than the basic Stochastic buy system we first tested. As shown in Table 4 above, the percentage of losing trades dropped from about 58% (using the basic Stochastic technique) to slightly over fifty percent. The annualized loss of the basic Stochastic buy turned into a slight annualized profit. These numbers are a significant improvement over the basic Stochastic buy system. Buy and holding the SPX showed a significant loss during 2008 and the modified Stochastic buy system showed a slight annualized profit.
These results are interesting, so I decided to run the test of the modified Stochastic system in each of the three test years we used before and with holding periods between three and seven days. The results of this testing are shown in Table 5, below.

Table 5: Modified System - 3, 5 & 7 Day Holding Periods
Comparing the results shown in Table 5 which uses the modified Stochastic buy system, with the previous results shown in the standard Stochastic buy system, indicates that adding the requirement that the Stochastic be below twenty for at least fifteen days significantly improves the results for the 2008 test period. However, it decreases the results during both the 2006 and 2007 test periods. This leads us to one of the key points of trading. Annual results, or comparing results over the last one, five, or ten year period are only meaningful if you know the next year, five years, or ten year period will be just like the last one. This is rarely the case. Rather than test in time periods, which most people do, traders should test systems in market conditions. Market conditions repeat, time periods usually do not. The market can only be trending up, trending down, or moving sideways. These periods are easy to recognize and occur frequently. Knowing how a tool performs in these three different market conditions allows us to look at the market, determine the type of environment and then select the tools that have performed best in that type of environment. This is market adaptive trading. The market will not adapt to us, so we must adapt to it.
Many traders are interested in knowing how a trading system did last year, or the year before. If they see these numbers it makes them happy, and they feel that is what they should expect going forward. When some people evaluate a mutual fund or money manager, they want to know how the performance was in each of the last few years. While this seems to make people happy, it does not mean much, or give a realistic expectation of what to expect going forward. The reason is that the market is not the same from one year to the next. How the market, or a trading system, performed last year may have little to do with how it will perform next year. Looking at annual returns may be interesting, but it does not tell you how and when to use a trading tool.
I know traders who took significant losses during 2008, using techniques that showed strong results over previous years. They had developed these systems by looking at annual results over several years. When 2008 came along, and the market did not look much like it had the previous few years, they experienced losses that wiped out the profits of several years of trading. I have seen traders that are looking for the hot hand, and when they find someone with good results in the previous year, they want that person to manage all their money because they think the hot hand will perform again next year. Strong results in the past year or two may have no bearing on next year if the market conditions change.
Rather than look just at annual results, I want to know how a trading system performs in bull and bear markets. No one knows what the market will do next year. Even the ‘expert’ economists have predicted ten of the last three recessions; they are usually all over the financial channels telling you we are in a recession, or a boom period, after they have started. Few, if any, consistently predict them in advance. Driving while looking in the rear view mirror can be problematic.
The market has just three basic modes. It can be trending up, a bullish period, it can be trending down, a bearish period, or it can be just moving sideways, a trading range period. The market’s overall movement is made up of a combination of bullish, bearish, and trading range periods. Years are convenient for us to mark time, but the market does not care about them. It simply moves in combinations of bullish, bearish, and trading range. It is hard for it to do anything else.
The chart below (Fig 5: OTC) shows the 2006 through 2008 market period during which the previous testing has been done. Looking at the chart you can see that the market started 2006 in a trading range environment. After the first week in May the market transitioned to a bear market environment, and declined until the end of July. From the end of July through November the market was in a bullish mode and then went back into a trading range environment. During this three year period the market showed four bearish periods, five bullish periods, and three trading range periods. The periods vary in length, but it is hard for the market to do anything but go up, down, or mostly sideways.

Fig 5: OTC
During the testing and evaluation of numerous trading systems I have seen that the market conditions, bullish, bearish, or trading range, have a strong effect on most systems. Because of this I have developed different trading systems for each of the three market conditions and refer to the collection of trading techniques as my trading tool box. When I see traders that are using just one tool in all market conditions, or are focused on annual results I realize that it will not be too long before they have either churned their account or see unacceptable losses. When I see a trader that has a tool box full of different techniques and picks the right one for the job I have typically found someone who has been around for awhile and knows how to trade.
The table below (Table 6: Market Types) shows the results of testing the basic Stochastic Buy indicator in bullish and bearish market conditions. Trades were taken using the basic Stochastic buy system. If the Stochastic indicator was below 20 yesterday and above 20 today then long positions were entered at the open the next day, held for five days and then sold. Trades were only taken in stocks with a twenty one day average volume of at least 200,000 shares.

Table 6: Market Types
The data in the table gives a much clearer picture of how the basic Stochastic buy system performs than just testing it over calendar timeframes. The table shows the results of more than seventy nine thousand trades, and indicates that the basic Stochastic buy performs dramatically better during bullish market periods than it does during any of the calendar time periods tested previously. During bullish market periods the percentage of winning trades was well above random chance and it showed an attractive annualized ROI in each of the seven bullish periods tested.
During every one of the bear market periods tested in the table above, the basic Stochastic buy system showed a percentage of winning trades less than random chance, and a negative annualized ROI. The basic Stochastic buy system is not an effective trading strategy in bear market conditions. The table also shows that the basic Stochastic buy system performed fairly well during trading range periods. The results were not as strong as the results during bullish market conditions, but in four of the five trading ranges the results showed the percentage of winning trades was above random chance.
The brief analysis of the Stochastic indicator covered in this article indicates that using it all the time, as done with our annual time period testing, is likely to result in poor results. The market condition testing indicates that this is because the Stochastic indicator shows good results in bullish market periods and poor results in bearish market periods. This tool, like most trading tools has market periods where it may be effective, and market periods where it may just lose money. Effective trading requires that one have multiple tools in the trading tool box and a clear understanding when to use a specific tool and when to use another based on market condition testing.
Some of the material in this article was used with permission from Traders Library and Marketplace Books who publish two books by the author with extensive information on the development, analysis, and use of several different trading tools. For more information see: Moneymaking Candlestick Patterns and How to Take Money from the Markets Since understanding the current market condition is a critical part of knowing when to use a specific trading tool.
Steve Palmquist can be contacted by email at Steve Palmquist
Last edited by a moderator:
