wannagetstacked
Well-known member
- Messages
- 287
- Likes
- 11
I've always been a huge fan of mr.marcus's posts but unfortunately never had the chance to meet or speak to him back in the day. I go back to the posts I saved of his often, and usually glean something from them that I hadn't considered before, which I can then go and investigate. He's probably the only trader I've paid attention to outside of my own studies.
I must be at or beyond 10,000 hours, maybe even 20,000 hours of purely studying price and volume charts, across many instruments and timeframes, over 3 decades now. I don't think I'll ever stop, even if there was no money to be made. It's an obsession. It's the greatest game in existence.
In the unashamed hopes of tempting him into a discussion on here (or in private ;-) ) I'm going to try some tribute analyses. If anyone knows Mark and can point him towards this thread that would be great.
In this thread I'll stick to daily stock charts. I feel too old for smaller timeframes, but feel free to post any chart and your analysis.
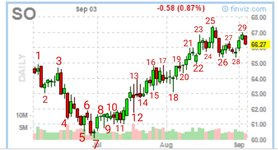
I've roughly numbered most of the turning points for ease of discussion. Let's dive in.

Now I certainly don't have the reverse engineering skills that Mark demonstrated, and of course I could look at the chart before the period shown, but let's assume I haven't.
I somewhat randomly picked this chart because it looks technically pretty. I'll start my comments on the next post because it will be annoying if something crashes and I have to write out the above again.
Cheers
Nathan
I must be at or beyond 10,000 hours, maybe even 20,000 hours of purely studying price and volume charts, across many instruments and timeframes, over 3 decades now. I don't think I'll ever stop, even if there was no money to be made. It's an obsession. It's the greatest game in existence.
In the unashamed hopes of tempting him into a discussion on here (or in private ;-) ) I'm going to try some tribute analyses. If anyone knows Mark and can point him towards this thread that would be great.
In this thread I'll stick to daily stock charts. I feel too old for smaller timeframes, but feel free to post any chart and your analysis.
I've roughly numbered most of the turning points for ease of discussion. Let's dive in.
Now I certainly don't have the reverse engineering skills that Mark demonstrated, and of course I could look at the chart before the period shown, but let's assume I haven't.
I somewhat randomly picked this chart because it looks technically pretty. I'll start my comments on the next post because it will be annoying if something crashes and I have to write out the above again.
Cheers
Nathan

