firewalker99
Legendary member
- Messages
- 6,655
- Likes
- 613
Exercise
Ok, let's try something.
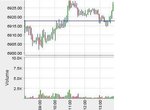
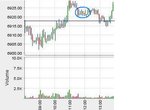
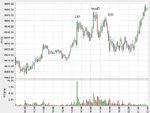
Here's a part of a chart from DAX (doesn't really matter which instrument) from some time ago.
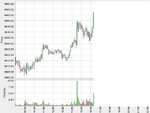
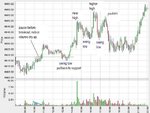
The blue line indicates potential resistance. You can see price stalling between 10-11am before breaching the resistance and breaking upwards. Volume on the breakout confirms the move. Later on we have a pullback to what now is support and near 1400pm we move higher.
Suppose we are long from 6905 early in the day, in anticipation of a break higher. Where would we exit and why? Most people will probably exit on the breakout or at least scale out half of their position there. But how do you manage your trade now? A trailing stop will stop you out much too early and most likely you will want to buy (or add to your position) again on the pullback.
So for the sake of the exercise we are still holding longs and price is currently at 6925 on the right side of the chart. What would you do to manage your trade and do you have a specific target in mind? I'll post the second part of the chart later on.

