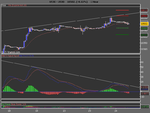
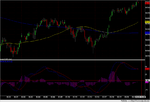
The Dow - May 23-27 2005

Look at the Volume after lunch - Almost exactly mirror images (inversely) the Price action.

Didn't want to go above 560 - Didn't want to go below 520 - for now.

The 'Support' at 520 was hard fought - I wouldn't bank on it holding tomorrow, at all.

If I didn't know any better I'd suspect some major stop running was being played here ahead of a fall... :devilish:
 
Basing it purely off support and resistance. Has broken 10500 level and next key level is 10600. If it fails here then I think it is destined to see 10200 - 10000 very quickly. If it breaks, then there is no major resistence on chart until 11000. How do you judge that the indices are overcooked? they have been downtrending for months and are only just starting to show signs that that trend is broken and an uptrend has resumed. The recent rally is hardly of any major significance and pales in comparison the the recent declines. Either way, price action dictates what is overcooked and what is not and the price action says the rally may just be finding its legs. 10600 will prove decisive. I will be ready to go either long or short at 10600 and am never married to predetermined directions as i find it make you miss the major moves.
 
Oops - sorry chaps

Sorry - just realised this is not the thread to discuss evening trades - apologies :eek:
 
Last edited:
If I didn't know any better I'd suspect some major stop running was being played here ahead of a fall...

Couldn't agree with you more.....We broke out after range trading for most of the session and had we moved another 10 points lower from the close price during the session then we would have given back the upside breakout that we saw at around 19.00.

Has broken 10500 level and next key level is 10600.

Its not as simple as that....

If it fails here then I think it is destined to see 10200 - 10000 very quickly.

Hopefully but we could range trade for a while....

If it breaks, then there is no major resistence on chart until 11000.

I disagree with that totally, HEAVY resistance at 10860 region on weekly chart.

For Tuesday we have support and seems like possible test of 10500. On the upside we have a little problem at around the 10550 area before we even think about 10600.

The intraday high that we saw today: is this the high of this upmove??? I reckon it could well be.

Volume did not support the move up and a break of 10500 could well lead us to play with 10400 before the end of this week.

I'm a little skeptical of the intraday breakout we saw in todays session.

Goodluck.
 
I agree there doesn't seem to be any major Resistance between 10500 and 11000. Doesn't mean there wont be any - just that technical analysis (centuries excepted as potential 'ramps') doesn't currently indicate any.

If you were asking me that question: - I don't 'judge indices are over-cooked'. I'm looking only at the Dow and basing my analysis on today's action within the landscape of what has happened in the recent past. Don't forget - the strength of previous Support and Resistance levels diminish over Time.

The Dow hasn't been downtrending for months? One way of looking at it, if you like, it formed a double-top Jan and Mar and the neckline has yet to be broken to the upside. Another way is that the first Fib (0.618) High/Low has been transacted.

Price action today doesn't have me agreeing with your position that it's a rally finding its legs...

Agreed, or course, it could go long or short - or sideways... :LOL:

My view is to the Short side, but like you, I'll be looking to switch and take a Long if it goes above 600 with sustained Strength (Volume).
 
neil said:
Sorry - just realised this is not the thread to discuss evening trades - apologies :eek:
Neil - this thread is for any discussion on Dow trades during the week May 23 to 27.
 
I'm in Cambridge all day tomorrow and wont be back until after lunch (EST) so I'll be looking forward to checking market action and posts then.

Good hunting....
 
Larry Connors of Tradingmarkets.com produced an interesting paper about a year ago on trading using the VIX.
He found that when the VIX moved more than 10% from its 10 day moving average it identified a market that was "stretched too far" and was ripe for reversal. Over the last 9 years it has correctly predicted a 2 to 3 day reversal better than 68% of the time.
Tonight the VIX closed at 12.95, 10 day MA is at 14.5, therefore 90% is 13.05, which means that this market uptrend is stretched too far.
His other VIX reversal signal has not happend yet though. For market sells, that is a 5 day closing low, but closing above its opening.
I shall watch the VIX and market with interest tomorrow.
regards, G McA
 
Well we broke out of the consolidation area but didn't go anywhere fast.

Sometimes you need to think of support/resistance as being "areas" rather than being a horizontal line at a fixed price.If you look back, 10480-10500 seemed to be the previous area of resistance and the pullback to 10490 in the morning seemed to be a retest of this as support. The thing to give you a clue here was the low RSI when it bounced off 10490.

Looking very oversold at 10550 with that divergence setting in afterwards it was unlikely to go any higher today for today at least.

All very easy with hindsight of course :LOL:
 

Attachments

  • chart.gif
    chart.gif
    17.6 KB · Views: 235
Looking at the 10 min chart, the tight range of the last two days looks a little like a flag.

Although the price has moved horizontally rather than pulling back the RSI has been given chance to drop back down to give more room for upside which is often indicative of a flag/pullback.

However, we are looking close to overbought on RSI and CCI but no signs of any divergence over the last 3 days which would normally suggest a drop.

Your guess is as good as mine for tomorow ;)

Happy trading!
 

Attachments

  • chart.gif
    chart.gif
    16.6 KB · Views: 215
Larry Connors of Tradingmarkets.com produced an interesting paper about a year ago on trading using the VIX.
He found that when the VIX moved more than 10% from its 10 day moving average it identified a market that was "stretched too far" and was ripe for reversal. Over the last 9 years it has correctly predicted a 2 to 3 day reversal better than 68% of the time.
Tonight the VIX closed at 12.95, 10 day MA is at 14.5, therefore 90% is 13.05, which means that this market uptrend is stretched too far.
His other VIX reversal signal has not happend yet though. For market sells, that is a 5 day closing low, but closing above its opening.
I shall watch the VIX and market with interest tomorrow.

Excellent stuff gmca686! Keep us up to date with that. I've been watching the VIX very closely as well. Goodluck with your trades and VIX
 
Divergence on MACD

Justin - I have a divergence with MACD on the one hour chart (see chart). In my experience, such divergence usually leads to a change of direction.(although it is only over two peaks, I would prefer three peaks) I find MACD very reliable on hourly and longer timeframes. In addition, price is below pivot point and moving towards first support at 10466.
 

Attachments

  • US30.png
    US30.png
    10.8 KB · Views: 206
Trading Shed said:
Justin - I have a divergence with MACD on the one hour chart (see chart). In my experience, such divergence usually leads to a change of direction.(although it is only over two peaks, I would prefer three peaks) I find MACD very reliable on hourly and longer timeframes. In addition, price is below pivot point and moving towards first support at 10466.

Filter out the out-of-hours flat-lining with a Pit-traded DJ template and there is no divergence at all - quite the opposite. In fact, in spite of being up in overbought territory, there's plenty room for more upside yet. I agree with Jusyn - that little flag needs watching. There are a lot of indicators saying a correction is becoming due (or resumtion of the DT depending on your point of view) - %age of NYSE stocks trading above 5,10 and 20 DMA's for example - they're all pushing 80%+ . But the retrace of the down move so far is mid way between two fib levels (50 and 62%ish) so, on balance, I'm looking for just a wee bit more upside yet before the bears take over again for a while. Could be a sharp one when it comes too so I don't intend getting caught long..
 

Attachments

  • YM24-5-5.png
    YM24-5-5.png
    66.2 KB · Views: 214
gmca686 said:
Larry Connors of Tradingmarkets.com produced an interesting paper about a year ago on trading using the VIX.
He found that when the VIX moved more than 10% from its 10 day moving average it identified a market that was "stretched too far" and was ripe for reversal. Over the last 9 years it has correctly predicted a 2 to 3 day reversal better than 68% of the time.
Tonight the VIX closed at 12.95, 10 day MA is at 14.5, therefore 90% is 13.05, which means that this market uptrend is stretched too far.
His other VIX reversal signal has not happend yet though. For market sells, that is a 5 day closing low, but closing above its opening.
I shall watch the VIX and market with interest tomorrow.
regards, G McA

Where can I find this VIX index, is it available on real time/
 
Justin - I have a divergence with MACD on the one hour chart (see chart). In my experience, such divergence usually leads to a change of direction.(although it is only over two peaks, I would prefer three peaks) I find MACD very reliable on hourly and longer timeframes. In addition, price is below pivot point and moving towards first support at 10466.

MACD isn't something I have ever used so I'm not qualified to comment.

My personal preference is to use RSI, CCI and volume. I find that attempting to add any further indicators only results in me getting "indicator overload" as well as indicators giving contradicting signals.

Futs are down to 10510 at the moment, let's see if we break down through the 480/500 level or bounce back up :cheesy:
 
justyn said:
Futs are down to 10510 at the moment, let's see if we break down through the 480/500 level or bounce back up :cheesy:

Yep. In spite of being determined not to be caught long I'm trading that gap - long at 10509 - 10 point stop target 10529. Not because gaps have magic qualities you understand. It's just that for some reason there's a mindset among the pros that YM opening gaps get filled early. In my experience (except for the obvious news related exceptions) they usually do too - a 70% + trade in fact. Streets ahead on them to date so here goes with another.

Where to after that I've no idea - neither do I care.
 
Divergence

Thank you for your comment Peterpr. Very interesting and I never though at how much difference there could be.
 
Where can I find this VIX index, is it available on real time/

http://stockcharts.com/def/servlet/SC.web?c=$VIX,uu[m,a]daclyymy[pb50!b200!f][vc60][iut]
 
rather than gambling on a gap fill which at the moment would equate to about 20 pips (not much reward)..would it not be better waiting for a touch of support to enter as that is also a phenomenon that works a high percentage of the time?....

so 10460 at some point?...which was incidently yesterdays pivot which it didnt hit and 7 times out of 10 the pivot is touched intraday......
 

Attachments

  • dow.gif
    dow.gif
    17.5 KB · Views: 216
so 10460 at some point?...which was incidently yesterdays pivot which it didnt hit and 7 times out of 10 the pivot is touched intraday......

Leeshindig,

just wondering how you calculate where these pivots are?

Justyn
 
Top