The Church of What's Happening Now: An Experiment in RTA

trendie said:
equally, there are people who ARE interested in understanding Volume, and how it can indicate markets behaviour, but it is difficult, since there appers to be no context to the thread.

Could you not start with a defined thesis/statement as to how volume works, and then start your commentary from there ?

I dont know what you are trying to show.
Or rather, you are getting other people to make statements, prove/disprove them, etc, which means some posts could be dead-ends.

I made a perfectly valid analysis of the market. That is not to say it is correct, but it is valid.
But because I didnt mention volume, it seems to have been overlooked.

Could you advise on any good books, pdfs where volume is shown to work ?

thanks :)

I've already made defined statements of how volume works in a 600+ post thread plus threads elsewhere, so there's no point in reiterating those threads. Those who don't want to read them aren't going to want to read another which will also be hundreds of posts long. Those who have read them and require a different approach may derive something from this thread, which I clearly labeled an experiment. You needn't hurry, and you may get nothing out of it at all. You won't be alone. Many arcs will be dead-ends. That's the nature of the scientific approach as well as the behavioral. If you believe it's all nonsense, that's perfectly all right as well.

As to your analysis, I won't be responding to every such post as there is no need. The accuracy or inaccuracy of whatever somebody says is independent of whatever I think about it. You say you don't know what buyers and sellers are doing after ten posts and I accept that. So, watch and listen and think about what you've seen and read and will see and read. Or move on. Your choice. There's no hurry. The market will be here.

As for books and pdfs, I have a reading list which will be sent to you if and when you register at my Yahoo site (icon below). There's not much, which is the reason for these threads. As to "how volume works", I don't know what that means. Volume is trading activity. It simply is. If you expect it to do something for you, then that is a task that you have set for it, like expecting a pig to sing. If it doesn't meet your expectations, that's hardly the pig's fault.

Again, those who think it's all nonsense and of little or no use needn't participate. If they refuse to allow those who are interested in the subject from discussing it, the thread will stop. I do this, after all, for nothing.

--Db
 
dbphoenix said:
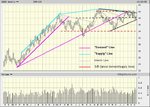
Anybody want to get into what one can conclude from changes in the slopes of the demand and supply lines? (These are Wyckoff's terms and don't necessarily have anything to do with the traditional meanings of demand and supply; what they refer to is those levels at which sellers regularly drive price down and buyers regularly drive price up. They have much in common with trendlines, but aren't quite the same thing.)

If no one wants to pursue this, that's fine. It can simmer for now. The market will be here. Reading the threads below will be of benefit to those who haven't done so.

--Db
 
dbphoenix said:
For now, anyway.

Anybody want to get into what one can conclude from changes in the slopes of the demand and supply lines? (These are Wyckoff's terms and don't necessarily have anything to do with the traditional meanings of demand and supply; what they refer to is those levels at which sellers regularly drive price down and buyers regularly drive price up. They have much in common with trendlines, but aren't quite the same thing.)

--Db
Supply: sellers had difficulty in driving price down in 2003 but are gradually getting stronger and since 2005they even manage to drive price down at lower levels.

Demand: buyers intent is fanning down. In the 2003 price was strongly driven up at subsequent higher levels. Since then the slope of the demand line has weakened. So demand is losing strength. In the beginning of 2005 price has even broken the fanned down Dline, even though this line is still upward.The fact that price has since then dint manage to brake above the fanned down Dline is evidence of the continuation of weakness in buyers efforts to drive price up.
 
Last edited:
dbphoenix said:
Anybody want to get into what one can conclude from changes in the slopes of the demand and supply lines? (These are Wyckoff's terms and don't necessarily have anything to do with the traditional meanings of demand and supply; what they refer to is those levels at which sellers regularly drive price down and buyers regularly drive price up. They have much in common with trendlines, but aren't quite the same thing.)

As (I think ) I understand it, the slope of a demand or supply line represents the difference between the "value" of a security (as perceived by buyers and sellers respectively) and its current price. The greater the difference, the steeper the lines.

The distance between the lines shows the extent of agreement on price at any particular point, and whether the lines are converging or diverging shows whether that level of agreement is increasing or decreasing.

Currently the supply line is flat to falling slightly, whilst the demand line is rising below, but progressively less steeply - which would indicate increasing agreement on a "value" between 34 and 40. Whether this process of agreement continues and a smaller range of "value" is defined remains to be seen.

From a directional trading perspective one might wait for this process of agreement to end and a new agenda (disagreement) to unfold.
 
An interesting way of looking at it, dsn, and one which may open a few windows, or at least agitate the soup . . .
 
The recent supply line has a reduced slope to the previous, and now interim supply line. This suggests a reduction in supply, although we remain firmly in the band of sideways action bounded by the lateral demand and supply lines. There would appear to be a possible confluence of resistance created by the three lines of supply, upper lateral supply, and an approach towards the latest demand line from below. Might we need a higher "interim" lateral demand line to form before a clear bias is formed between supply and demand?
Q
 
A note, going back to post 16. "Demand line" and "suppy line" are Wyckoff's terms, but anyone having trouble wrapping their minds around this should think of these as selling pressure and buying pressure, since what are now the traditional meanings of demand and supply don't quite suit. Quercus' post, for example, might make more sense to some by substituting these terms, e.g., "this suggests a reduction in selling pressure". Buying pressure and selling pressure are, after all, what these lines are all about, as well as other S/R, and are perhaps much clearer and more specific when discussing the subject.

Just a suggestion.

--Db
 
Last edited:
Agreed, and it seems to suit the mood a little better too - a reduction in selling pressure is simply that and may be a pause before further selling pressure, or a complete change of mood!
Re-visiting the chart with an eye on volume, there appears to have been a recent increase in buying pressure indicated by the higher volume of around 0.6, which resulted in what would be a hammer on a candlestick chart.
Interesting times ahead!
Q
 
Yes, and using the term "supply" just doesn't apply to much of what we trade these days since it implies some sort of inventory.

As for "volume", again, think number of transactions rather than "volume", much less a bar or indicator. Transactions don't begin and end with a bar any more than buying or selling interest does.

--Db
 
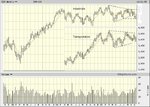
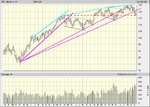
Here's the S&P, for grins. The red line may mean nothing.

--Db
 

Attachments

  • Image2.jpg
    Image2.jpg
    112.1 KB · Views: 563
Keeping an eye on this "hinge" . . .
 

Attachments

  • Image1a.jpg
    Image1a.jpg
    113.6 KB · Views: 618
Those of you who picked up on the increase in buying pressure and decrease in selling pressure would have been happy today. Given the context of the weekly charts posted, anyone wanting to post daily charts is welcome to do so.

--Db
 
Check the FAQ above, Posting Messages, What Are Attachments?
 
Last edited:
dbphoenix said:
I've already made defined statements of how volume works in a 600+ post thread plus threads elsewhere, so there's no point in reiterating those threads. Those who don't want to read them aren't going to want to read another which will also be hundreds of posts long. Those who have read them and require a different approach may derive something from this thread, which I clearly labeled an experiment. You needn't hurry, and you may get nothing out of it at all. You won't be alone. Many arcs will be dead-ends. That's the nature of the scientific approach as well as the behavioral. If you believe it's all nonsense, that's perfectly all right as well.

As to your analysis, I won't be responding to every such post as there is no need. The accuracy or inaccuracy of whatever somebody says is independent of whatever I think about it. You say you don't know what buyers and sellers are doing after ten posts and I accept that. So, watch and listen and think about what you've seen and read and will see and read. Or move on. Your choice. There's no hurry. The market will be here.

As for books and pdfs, I have a reading list which will be sent to you if and when you register at my Yahoo site (icon below). There's not much, which is the reason for these threads. As to "how volume works", I don't know what that means. Volume is trading activity. It simply is. If you expect it to do something for you, then that is a task that you have set for it, like expecting a pig to sing. If it doesn't meet your expectations, that's hardly the pig's fault.

Again, those who think it's all nonsense and of little or no use needn't participate. If they refuse to allow those who are interested in the subject from discussing it, the thread will stop. I do this, after all, for nothing.

--Db
Of all the posts you have ever made on any thread this one has to be the best, it is a real corker and has caused me to choke on my breakfast cereal. It is so good I am printing it and turning it into a poster. My compliments to you.
 
dbphoenix said:
Again, those who think it's all nonsense and of little or no use needn't participate. If they refuse to allow those who are interested in the subject from discussing it, the thread will stop.

. . .
 
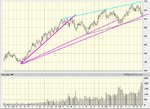
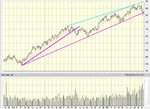
And small and midcaps . . .
 

Attachments

  • Image5.jpg
    Image5.jpg
    101.6 KB · Views: 323
  • Image6.jpg
    Image6.jpg
    97 KB · Views: 274
dbphoenix said:
Those of you who picked up on the increase in buying pressure and decrease in selling pressure would have been happy today. Given the context of the weekly charts posted, anyone wanting to post daily charts is welcome to do so.

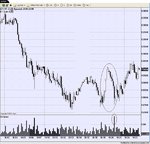
The straight up and straight down price action last Wednesday/Thursday looked familiar. Looking at previous lows on the daily chart price often becomes volatile with obvious long 'buy' candles being completely retraced the next day.

Could this be an attempt to shake out some additional contracts? If so, the volume spike on the hourly chart on Thursday would suggest success in this case. In spite of the heavy selling induced, price was supported above Wednesday's low indicating accumulation in the short term - as has been noted on the larger timeframes.
 

Attachments

  • snapshot-7.png.jpg
    snapshot-7.png.jpg
    134.1 KB · Views: 327
Nice to see your contribution dsn. When looking at potential s/r for the ES it seems more and more I look to the $SPX .
A. --- early longs panic as they think they are suddenly on the wrong side of the trade.
B. --- test of potential bottom
C---- rise in price
D--- higher low and away we go..........


erie
 

Attachments

  • $SPX.gif
    $SPX.gif
    45.9 KB · Views: 336
Top