You are using an out of date browser. It may not display this or other websites correctly.
You should upgrade or use an alternative browser.
You should upgrade or use an alternative browser.
The Church of What's Happening Now: An Experiment in RTA
dbphoenix said:RTA being Real Time Analysis.
Look.
See.
Think.
What are buyers doing?
What are sellers doing?
--Db
2003 - Plenty of buyers - moderate volume suggests little selling resistance as price rises.
2004 - Higher volume buyers and sellers alternating but sellers are stronger until August when selling eases at support and buyers dominate untill resistance at 40 is reached - volume drops as buying subsides.
2005 - Jan to April - Highish volume as sellers overcome buyers and push price back to support at 34.
April to Sept - Lower volume sellers have eased and buyers are meeting less oposition as price rises back to resistance at 40.
Sept to Date - Volume increasing - price starting to fall - suggesting that sellers are back.
The price is in a channel between 34 and 40.
Regards
bracke
Last edited:
dbphoenix
Guest Author
- Messages
- 6,954
- Likes
- 1,266
bracke said:The latest increase in volume and fall in price would seem to suggest that 34 is the likely destination.
What happens next is not the concern of TCOWHN.
--Db
dbphoenix said:What happens next is not the concern of TCOWHN.
--Db
Thank you for your reply. I have edited my post accordingly.
Regards
bracke
barjon
Legendary member
- Messages
- 10,752
- Likes
- 1,863
db
fwiw (not a lot, probably)
from 04 on buyers appear to be taking a strong interest when the price is around 34 - on the one occasion they showed less interest and the price fell below that there was no selling follow through - and losing interest (rather than being driven back by sellers) when the price is around 40.
cheers
jon
dbphoenix
Guest Author
- Messages
- 6,954
- Likes
- 1,266
bracke said:Thank you for your reply. I have edited my post accordingly.
Surak is pleased . . .
dbphoenix said:Surak is pleased . . .
Good and by the way no mind probes.
Regards
bracke
erierambler
Well-known member
- Messages
- 265
- Likes
- 8
Lst?bs
Since beginning of 04 horizontal range between 34 en 40.
One break of S at 34 rejected in early 04 and one break of R at 40 rejected in late 04.
Since mid 05 testing R at 40. Last test at 40 test has been rejected on strong volume but now price again shows effort to rise,
although volume is still low.
Possible new S at about 38?
Last edited:
dbphoenix
Guest Author
- Messages
- 6,954
- Likes
- 1,266
contrakt said:Since beginning of 04 horizontal range between 38 en 40.
One break of S at 34 rejected in early 04 and one break
of R at 40 rejected in late 04.
Since mid 05 testing R at 40. Last test at 40 test has been rejected on strong volume but now price again shows effort to rise,
although volume is still low.
Possible new S at about 38?
a. I think you mean 34 and 40.
b. for this experiment, try thinking "transactions" rather than "volume", e.g., rather than "strong volume", think "higher number or greater number of transactions". Then explain what you mean by "rejection" and what "low" implies. Think about what people are doing, or not doing, that results in these bars.
c. why possible S at 38?
abc
a. Yes
b.
On "last wk - 2" R was tested at 40.
40 wasnt broken to the uspside. Instead, on "last wk - 2" price got propeled far back into range towards 38-ish on a "higher number of transactions". This is relative to transactions intensity of "last wk - 3", which was a upday.
Nevertheless, on "last wk - 2" price didnt end at the absolute low.
On "last wky-1" price dipped beneath 38, but managed, even on a "higher number of transactions", to end at 38.
The close at 38 was after substantial recovery from a intraday low.
On "last wk" price didnt malke a new low and even went up on a lower number of transactions (compared to "last wk - 2" or "last wk - 1").
c.
2 times in 2004 and 2 times in 2005 price met R at 38 and since the July 05 "last day-1" price moved between [38-40]
In this period daily price 4* found S at 38-ish.
Last edited:
dbphoenix
Guest Author
- Messages
- 6,954
- Likes
- 1,266
contrakt said:b.
On "last day - 2" R was tested at 40.
40 wasnt broken to the uspside. Instead, on "last day - 2" price got propeled far back into range towards 38-ish on a "higher number of transactions".
And what from that can you surmise with regard to what buyers and sellers are doing, or did? "More transactions" means more trading activity. The result of that activity is a drop in price. Translate that into buyer/seller behavior.
On "last day-1" price dipped beneath 38, but managed, even on a "higher number of transactions", to end at 38.
Ditto, only this time price rose.
On "last day" price didnt make a new low and even went up on a lower number of transactions (compared to "last day - 2" or "last day - 1").
Ditto.
c.
2 times in 2004 and 2 times in 2005 price met R at 38 and since the July 05 "last day-1" price moved between [38-40]
In this period daily price 4* found S at 38-ish.
Nice.
--Db
A] On a high activity day, selling pressure overwhelmed buying action, causing price to drop for that day. At the end of the day buyers recouped some of the lost ground.dbphoenix said:A] And what from that can you surmise with regard to what buyers and sellers are doing, or did? "More transactions" means more trading activity. The result of that activity is a drop in price. Translate that into buyer/seller behaviour.
B] Ditto, only this time price rose.
C]Nice.
--Db
B] On high activity day, buyers where more active than sellers, causing price to rise for that day. At the end of the day sellers recouped some of the lost ground.
A+B] a test and reversal at R =38
C] Respect
dbphoenix
Guest Author
- Messages
- 6,954
- Likes
- 1,266
About my third question regarding the rise on a lower number of transactions, I've altered the chart by updating the last bar to include yesterday. "Volume" is still lower than the previous bar (note that this is a weekly chart, but it doesn't matter as far as the subject is concerned), but I don't want anyone to think they're hallucinating.
So, what does a rise on a lower number of transactions tell you (your "last day" comment)?
--Db
So, what does a rise on a lower number of transactions tell you (your "last day" comment)?
--Db
adjusted posts for weekly.dbphoenix said:About my third question regarding the rise on a lower number of transactions, I've altered the chart by updating the last bar to include yesterday. "Volume" is still lower than the previous bar (note that this is a weekly chart, but it doesn't matter as far as the subject is concerned), but I don't want anyone to think they're hallucinating.
So, what does a rise on a lower number of transactions tell you (your "last day" comment)?
--Db
Sellers activity this last week is lower than a week ago. Buyers manage to dominate price action in this low activity environment.
Lack of selling pressure, allows dominating buying pressure in this low activity week.
Last edited:
dbphoenix
Guest Author
- Messages
- 6,954
- Likes
- 1,266
For now, anyway.
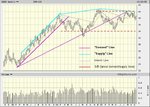
Anybody want to get into what one can conclude from changes in the slopes of the demand and supply lines? (These are Wyckoff's terms and don't necessarily have anything to do with the traditional meanings of demand and supply; what they refer to is those levels at which sellers regularly drive price down and buyers regularly drive price up. They have much in common with trendlines, but aren't quite the same thing.)
--Db
counter_violent
Legendary member
- Messages
- 12,672
- Likes
- 3,787
dbphoenix said:So, if you have no interest in the thread, pass it by. No one is asking you to read it, much less agree with its content. There are many other threads which require your commentary.
--Db
Is that so !
Nope, I can't think of One
C V
frdyr
Newbie
- Messages
- 6
- Likes
- 0
dbphoenix said:And what from that can you surmise with regard to what buyers and sellers are doing, or did? "More transactions" means more trading activity. The result of that activity is a drop in price. Translate that into buyer/seller behavior.
I'll have a shot...
More transactions means people are actively stepping into the market to sell their holdings (compared to price falling because of an absense of buyers). The reason it fell 'so much' was insufficient buying support at a particular price to take all that was offered. Hence trades were made at progressively lower prices until buyers had soaked up all that was for sale.
Something like that anyhow.
Regards,
Frank
Similar threads
- Replies
- 53
- Views
- 9K


