The Challenge

A look at where we are on the daily

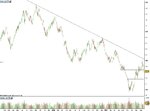
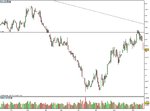
Two different views of where we are on the daily timeframe.

One taken from further out so that the previous support levels and connecting highs that form the descending TL can clearly be seen.
 

Attachments

  • BUND1.jpg
    BUND1.jpg
    93.2 KB · Views: 144
  • BUND2.jpg
    BUND2.jpg
    93.2 KB · Views: 137
Last edited:
Two different views of where we are on the daily timeframe.

One taken from further out so that the previous support levels and connecting highs that form the descending TL can clearly be seen.

I'm currently sitting on a 53 pip profit and I can see some resistance going on in the charts. However I see no end to the downtrend for the moment so I'm holidng.
 
I'm currently sitting on a 53 pip profit and I can see some resistance going on in the charts. However I see no end to the downtrend for the moment so I'm holidng.

Good call! Are you still holding? I see little in the way of meaningful support until around 111.85 on the daily chart.
 
Good call! Are you still holding? I see little in the way of meaningful support until around 111.85 on the daily chart.

Closed this morning 112.54 - 109 pnts. A possible pullback forming so taking my money at this point. 1 down - many more to go... I'll trade this (and a few other instruments) on demo up to Xmas and go live in the new year if I've made a good profit. I'm testing out a new strategy and some new commodities/bonds.
 
There were some good opportunities today...suffice to say I missed them all.

The hourly showed a pin bar at a double bottom with confluence of the 50 fib (June lows to Sep highs). The 30m showed the same pin bar but also one at the 112.60 S/R pivot which would have been a great close and reverse trade.

At any rate, I wasn't watching as closely as I should have been.

It's day like this that are starting to make me think more and more lately about leaving work to trade full time...

Forget for a moment that I'm not consistently profitable yet...

I decided to stay out today, I couldn't determine with any confidence which way things were going.

I strongly suggest you don't give up work just yet! You'll be putting so much pressure on yourself to make money that you're bound to make costly mistakes. I'm not a scalper or day trader but I would have thought trading only the bund leaves you rather exposed. Wouldn't you be better diversifying into forex and indicies too? That way you can take the good opportunities as they present themselves and you're able to ignore the so-so situations that you may feel oblidged to trade if you were only trading the bund.

At least if you diversify into American indicies/forex you can trade an hour or two in the evenings when you get home from work to get a real taste of what you might be doing 5 days a week.
 
Bund formed a low at 112.19 on the charts, either a short pullback or a resumption of the main long term trend has now ensued. I am now long at 112.70, I'm running a fairly tight stop on this one though.
 
I'm not a scalper or day trader but I would have thought trading only the bund leaves you rather exposed. Wouldn't you be better diversifying into forex and indicies too? That way you can take the good opportunities as they present themselves and you're able to ignore the so-so situations that you may feel oblidged to trade if you were only trading the bund.

At least if you diversify into American indicies/forex you can trade an hour or two in the evenings when you get home from work to get a real taste of what you might be doing 5 days a week.

I will let you into a little secret.

Since I started this challenge, I have noticed the same profitable setups that I use here, in other markets. So around three months ago now, I started trading these also.

I have had a good deal of success with this but I won't go into that further here. I want to keep it focused on the Bund.
 
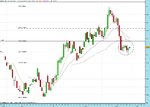
There was a perfect short set up yesterday.

They really don't come looking much better than this.

Pin bar (circled) with the nose directly on a prominent S/R level (this made me particularly confident as I have had it on my charts for some time now).

That S/R level also happened to almost directly coincide with the 23 fib of the swing down.

The nose of the pin had also found resistance from the daily 50ema.

I had an order in the market to go short at £2 a point with the stop above the pin but for some reason, instinct interfered and I cancelled the order shortly before it would have triggered...I honestly do not know why I did this. I thought I would post the proof anyway...
 

Attachments

  • bund1.JPG
    bund1.JPG
    110.4 KB · Views: 160
  • proof.JPG
    proof.JPG
    31.2 KB · Views: 176
There was a perfect short set up yesterday.

They really don't come looking much better than this.

Pin bar (circled) with the nose directly on a prominent S/R level (this made me particularly confident as I have had it on my charts for some time now).

That S/R level also happened to almost directly coincide with the 23 fib of the swing down.

The nose of the pin had also found resistance from the daily 50ema.

I had an order in the market to go short at £2 a point with the stop above the pin but for some reason, instinct interfered and I cancelled the order shortly before it would have triggered...I honestly do not know why I did this. I thought I would post the proof anyway...

I exited my trade for a small loss yesterday morning. sitting on the sidelines for now but looking like I'll be going short.
 
There was a perfect short set up yesterday.

And it may still work but I don't feel so bad I didn't enter it now...

Price has been going sideways for the last five sessions but there is support here at the 50 fib and price made a pin bar on the daily with the nose extending towards further support at 112.00 so I decided to go long on the close last night.

I went in at 112.44 at £2 a tick with a stop just below the pin at 112.01.
 

Attachments

  • bund1.jpg
    bund1.jpg
    121.4 KB · Views: 148
So, 7 months of the challenge remaining.

Starting balance: £1,000

Target: £10,000

Current balance: £1,066

Well, at least I'm in the black...
 
Bond Trader,

"In the black", in itself commendable, but also continually learning, which is of equal, if not of greater, value.

Well done, mate.

Perhaps volume will help in your approach(?).

Good trading.

Grant.
 
hey guys...do you look at the yield levels while entering a trade or is it just the price action and the technicals??...i was just thinking that we could also look at the yield supports apart from the price supports....
 
hey guys...do you look at the yield levels while entering a trade or is it just the price action and the technicals??...i was just thinking that we could also look at the yield supports apart from the price supports....

Hi futures_trader,

Welcome to the thread - thank you for posting.

I know some traders look at the yield when making a decision but I just concentrate on the price action and technicals. I am trying to keep things as simple as possible at the moment.

If you discover anything interesting on this or have more information, please feel free to post it here.

I would like this thread to be a place for the experienced and inexperienced alike, to get together and discuss / discover ways to profit from the Bund/Bobl.
 
Hi everyone,

Big picture analysis is always helpful.

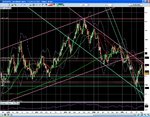
Here's a 5 year (weekly) chart.

Observations:
Still in the downtrend channel from the peak in 2005.
Failed test in early Sept 2007.
Close to the pivot of circa 11180.
OBV not too bad considering large downcandle in the prior week.
 

Attachments

  • Bund 280907 weekly.JPG
    Bund 280907 weekly.JPG
    274 KB · Views: 155
Perhaps volume will help in your approach(?).

I sent Grant a PM asking him for more information and he kindly replied with the following (posted with his permission):

I’m referring to number of contracts traded per time period, eg 5 minutes, 60 minutes, 1 day. I use this as measure of buyers’/sellers’ conviction.

For example, assume the bund has been rising throughout the day and your system gives a buy signal. Check the volume to see if this has been increasing with the price. If not, usually means lack of support or conviction for taking the price higher, and therefore possible underlying weakness.

If the price rises but on ever decreasing volume, watch for turn in the price (however, a lack of sellers – resistance - on a price rise on low volume may also be possible). Similarly, heavy or rising volume on a rising price usually indicates good support.

The converse applies to a sell signal/falling price.

As with all indicators, the rules are not concrete. A rising price with falling volume may indicate weakness but sod’s law dictates that if you ignore your buy signal, a flood of large buyers will suddenly come in and the price will rocket. Regardless, I reckon volume as an indicator will certainly supplement any indicator.

I’ve been trying to find an illustration from today’s charts but in vain. That’s life.


I'll be honest, I've largely ignored volume even though I have heard many traders say it is incredibly useful.

The main feed I use to watch the Bund does not supply volume data. However, from time to time I use another feed for historical data on the Bund (EOD only) and this does provide volume. I will take a closer look when time permits...
 
Big picture analysis is always helpful.

Still in the downtrend channel from the peak in 2005.
Failed test in early Sept 2007.
Close to the pivot of circa 11180.
OBV not too bad considering large downcandle in the prior week.

Fibonelli,

Some very useful and interesting observations. The highs that connect the descending TL line up much better on your chart than they do on mine but nonetheless, I agree, September saw a failed test and the longer term pictures looks, or at least, feels bearish. However, let's see if this pivot holds.

I have tried some indicators but on the whole trade without them. Have you found OBV to be particularly useful?

BT1,

I agree with Grantx. Volume is very important in order to establish the probability of a trend sustaining itself. I find volume indicators such as OBV, Money Flow etc to be very helpful in confirming whether or not volume is in agreement with price and of highlighting divergences. For example, there was divergence in the OBV compared with the contract all time high in Sept 2005.
 
Top