barjon
Legendary member
- Messages
- 10,752
- Likes
- 1,863
bracke said:barjon
Thank you for your reply
Referring to my example eod 21/09 @ 4608
The eod low of the previous 20 days was 23/08 @ 4405 which means a 203 point drop before closing the trade and is a little too rich for me.
Since the 21/09 the lowest close was 27/09 @ 4541 a 67 point drawdown.
The index has not closed above 4608.
I would not be happy with this trade.
Not quite clear on the 21st day dropping off.
Regards
bracke
bracke,
Been off piste for a bit and just catching up.
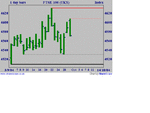
I'm not sure you had it quite right. If you were embarking on the system today you would see the thumbnail chart. You would be waiting for ftse to rise above the high (thick red line) or fall below the low (thick black line). At the close today's bar would print and 3/9 bar (21st day) would drop off the chart and the low would change to the dotted black line. Similarly, after 14 days the 22/9 high bar would drop off leaving the high as the dotted red line (assuming ftse had not risen above that level in the meantime).
The highs and lows are dynamic and thus the points at which you would stop and reverse change as the highs and lows change. The system means you're always in the market, either long or short.
I'm not advocating the system, just explaining it as I understand it (someone will correct me if I've got it wrong 😆 ). As others said it's the basic system that the Turtles tweaked a bit and, like many, it works extremely well in trending markets.
good trading
jon

