You are using an out of date browser. It may not display this or other websites correctly.
You should upgrade or use an alternative browser.
You should upgrade or use an alternative browser.
Hi piker - Me too. Still have my limit order from last weekend placed just above the high of 11/12, now also just above high of 17/12. But I don't see price triggering that in a hurry.
Charts are equivocal. If 11 or 14/12 were swing lows, in traditional usage, i.e. with high as entry and low as stop, we already breached their stops on 17/12. More sensible to use 17/12 putative as swing low: if confirmed, this is a wide range bar so my position is going to have to be scaled down a bit.
Charts are equivocal. If 11 or 14/12 were swing lows, in traditional usage, i.e. with high as entry and low as stop, we already breached their stops on 17/12. More sensible to use 17/12 putative as swing low: if confirmed, this is a wide range bar so my position is going to have to be scaled down a bit.
robster970
Guest Author
- Messages
- 4,567
- Likes
- 1,390
Originally Posted by piker View Post
SPX Re-entered Long 1110.9
Closed -3.7 combined, to be frank I don't like the price action in stock indexes, I will probably be on sideline for now in indexes
Shame. Think you had a good basis for a longer term trade and target here. How quickly are you trying to realise returns generally? Days, weeks, months?
piker
Active member
- Messages
- 151
- Likes
- 6
Shame. Think you had a good basis for a longer term trade and target here. How quickly are you trying to realise returns generally? Days, weeks, months?
I like cutting stops, I never add to losing trades or move stop based on emotions. I would rather seek another entry. My thaughts on this matter are that if price failed to pull away and returned to your entry and lower that means it wasn't start of a real move, longer term charts are not based on random price action, but on longer term outlooks of people that understand fundamentals. I don't, so I have no choice but respect stops below low of Current reaction low on the chart of signal
robster970
Guest Author
- Messages
- 4,567
- Likes
- 1,390
I like cutting stops, I never add to losing trades or move stop based on emotions. I would rather seek another entry. My thaughts on this matter are that if price failed to pull away and returned to your entry and lower that means it wasn't start of a real move, longer term charts are not based on random price action, but on longer term outlooks of people that understand fundamentals. I don't, so I have no choice but respect stops below low of Current reaction low on the chart of signal
Good call then. Cutting a loser early. 🙂
piker
Active member
- Messages
- 151
- Likes
- 6
Thanks, I have no problems respecting stops, I find it more difficult letting trades run, I think that is an issue for a vast majority, knowing when trade reached maturity, because if there is no optimal entry, then there is no optimal exit, in my case it's money management, win more
robster970
Guest Author
- Messages
- 4,567
- Likes
- 1,390
Robster, I just realised u were asking about SPX, I was talking about gold. As I said pa is not convincing enough
What you said was equally as applicable given the way ES has moved this week. Still a good call and motive for exit.
B
Black Swan
Trade was closed 1106.8 -0.5% capital
Sorry I didn't post much I was busy short term trading, it's not what I enjoy doing, I am trying to pull away from eye balling price action. I am a **** short term trader, money management saves my skin.
Anyway, +1.82% capital on short term.
😆 never used this emoticon before...:clap:
piker
Active member
- Messages
- 151
- Likes
- 6
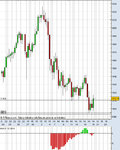
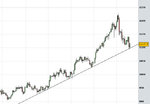
Ok. I am ready to go Long gold spot at the open. Same motive as before - longer term uptrend. Signal this time is again 8 hour chart, current dip is marked by a relatively tight trough in histogram which suggests we might be hitting proper support this time. Price sitting on rising trend line on dailys.
Plan's conditions have been met: 1 - Divergence in place; 2 - Price took out resistance $1,111.
Current initial stop will be $1,093 which is about $2 below current reaction low on 8 hour chart (signal chart).
Target remains at least $1,200.
This time I will be raising risk to 1% capital compared to 0.5% last time. Stop will be about $20, therefore I will stake £5 per every $1.
Attachments
Last edited:
piker
Active member
- Messages
- 151
- Likes
- 6
I had a look at the stock indexes over this weekend & I decided that I will be playing Nasdaq 100 from the long side upon a break of 1816.5 with a stop at 1775 which is a couple of bucks below current reaction low on 8 hour frame. Target will be around 1960 which is taken of weeklys as next resistance zone. I will allocate 1% capital as risk for stop allocation.
The reason I like Nas & dislike SPX is because SPX has been in a congestion period for a long time now, INDU is locked in a megaphone type price action (which technically is bearish when lower low is blown, not yet happened) & the Nas is in a nice ascending triangle, histogram points to strengthening price action & last thing I noticed is that Friday volume was strong in the Nas, the last time we observed such huge daily exchange was probably back in March 2009 when Nas put in a second bottom. I don't normally look at volume, but this paired with other factors made me think that a breakout is more likely than a breakdown.
Filled Long 1,817.00
Attachments
Last edited:
piker
Active member
- Messages
- 151
- Likes
- 6
Attachments
Last edited:
Limit order to buy gold spot 1098 with stop @ 1089, risk 1% capital (£11 per $1)
Ditto buy level and stop for me too.
piker
Active member
- Messages
- 151
- Likes
- 6
Ditto buy level and stop for me too.
That order is now cancelled, price went lower making previous stop within noise area. Daily trend is now broken, so I will either short it or wait for weekly trend line to go long.
piker
Active member
- Messages
- 151
- Likes
- 6
I had a look at the stock indexes over this weekend & I decided that I will be playing Nasdaq 100 from the long side upon a break of 1816.5 with a stop at 1775 which is a couple of bucks below current reaction low on 8 hour frame. Target will be around 1960 which is taken of weeklys as next resistance zone. I will allocate 1% capital as risk for stop allocation.
The reason I like Nas & dislike SPX is because SPX has been in a congestion period for a long time now, INDU is locked in a megaphone type price action (which technically is bearish when lower low is blown, not yet happened) & the Nas is in a nice ascending triangle, histogram points to strengthening price action & last thing I noticed is that Friday volume was strong in the Nas, the last time we observed such huge daily exchange was probably back in March 2009 when Nas put in a second bottom. I don't normally look at volume, but this paired with other factors made me think that a breakout is more likely than a breakdown.
Filled Long 1,817.00
Closing this trade over holiday period @ 1857.4. No more trading till 2010. Merry Christmas & a prosperous 2010 to all. Flat over holiday period.
P.S. Don't drink & drive 🙂
Last edited:
Similar threads
- Replies
- 0
- Views
- 254
- Replies
- 4
- Views
- 2K


