Stan Weinstein's Stage Analysis

Hi isatrader, it's amazing how long you've been contributing to this thread... Just want to say good job!
Out of curiosity - how has your performance been so far following this method? It's been a while I see... Thanks

Performance has been reasonable, but I've made a lot of mistakes that weren't related to the method, and so I only have around a 25% return in my SIPP currently from the account I started in August 2013. Which I'm still pleased with for a pension account, but would have been much better if I'd not made some impulsive choices that broke the rules. As the method is sound. But you have to stay disciplined, which isn't always easy, especially during the pullback periods that you need to sit through with the investor method. It has taught me a lot of patience though.

Anyway, I moved over to my own website a few years ago, as this thread was getting too big to manage the content. That now has thousands of posts and multiple threads all to do with Stage Analysis, and I have daily watchlists for the method for US and UK stocks. You can find it by searching for Stage Analysis Forum on Google.
 
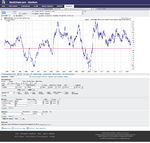
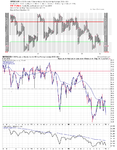
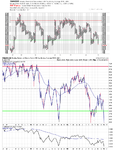
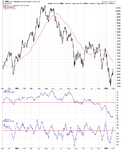
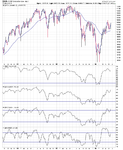
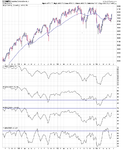
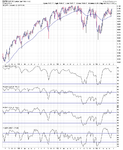
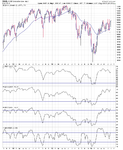
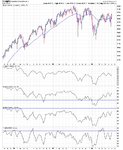
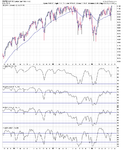
Attached is the updated NYSE Bullish Percent Index and the NYSE long, medium and short term moving average breadth charts, the advance decline line and the new high new lows.

The rest of the regular weekend market breadth update is available to subscribers only in the main Market Breadth thread in the Elite Members Board on the Stage Analysis website, including the exclusive US Industry Sectors Breadth charts, the S&P 500 Cumulative P&F Breakouts - Breakdowns charts, the New Highs New Lows charts, the Advance Decline Breadth Charts and more...

The NYSE Bullish Percent Index

View attachment 183798

NYSE Percentage of Stocks above their 200 Day, 150 Day and 50 Day Moving Averages P&F charts

View attachment 183800View attachment 183802View attachment 183804

Advance Decline Line

View attachment 183806

New Highs New Lows

View attachment 183808

Hello Isatrader - quick question. I have been a big fan of the Stan Weinstein Momentum Indicator (200MA of the cum A-D line)- which it looks like you have here label 'Advance Decline Line'. My old charting program crashed and I'm trying to construct this in Stock Charts - which looks similar to your chart. Except I can't get that middle window to look like yours - with the swing between 90 and 220 (late 2014 period in your chart). I have added an indicator window for $NYAD set as cumulative and an overlay for the 200MA - but it's just a replica of the top price window. It seems Stock Charts won't let me add just a 200MA line in that indicator window.

Do you have any tips on scaling or settings to get that swing line between 90 and 220? BTW your numbers match what I was able to produce in my old SuperCharts program.

Thanks for any help you can provide! 🙂

I've attached an up to date Advance Decline chart and a separate long term Momentum Index chart for you with the stockcharts settings on each so that you can copy them. Although you need to be a stockcharts subscriber to use some of the features to make it.
 

Attachments

  • $NYAD_27-7-15.png
    $NYAD_27-7-15.png
    106.7 KB · Views: 346
  • $NYAD_momentum_index_27-7-15.png
    $NYAD_momentum_index_27-7-15.png
    79.7 KB · Views: 335
I've attached an up to date Advance Decline chart and a separate long term Momentum Index chart for you with the stockcharts settings on each so that you can copy them. Although you need to be a stockcharts subscriber to use some of the features to make it.

Thanks - got it working. It was making the price invisible in the indicator window that did the trick.

Thanks again!
 
Hi,
Why does Stan Wesintein only look at monthly charts in his book with the 30 Week MA? If today we look at our markets on the monthly chart we would see the market is way above the 30 week MA. We are below on the daily and weekly 30 Week MA. Confused as to why Weinstein says to use the monthly charts? Thanks for the clarification as to what charts we need to be looking at to follow the stage analysis principles outlined in his book.

I'm not sure where you got the monthly charts from, as the majority of charts in the book are weekly charts with a 30 week MA.
 
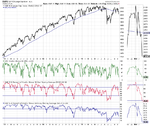
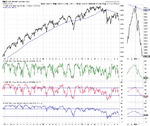
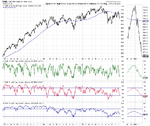
Major US Stock Indexes Update - NYSE, Nasdaq, S&P 500, Mid Caps and Small Caps

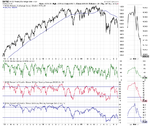
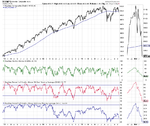
Attached is the updated US equity index charts.

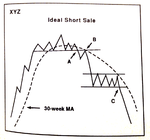
Note: A number of the indexes have moved back into Stage 4 this week following the pullback to what could possibly be considered the equivalent to the B entry point in the method for short sales imo. See chart 7-13 from page 229 in the book.

chart_7-13_Ideal_Short_Sale.png

US Stock Indexes

NYSE_W_11-12-15.pngCOMPQ_W_11-12-15.png

SPX_W_11-12-15.pngMID_W_11-12-15.pngSML_W_11-12-15.png
 
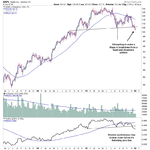
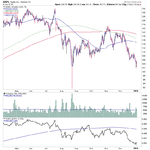
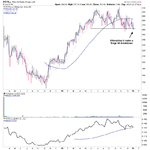
AAPL - Stage 4 breakdown attempt

AAPL - is attempting to break below the long term support from the head and shoulders pattern and relative performance has broken down below a flattening zero line. Potential for full Stage 4 breakdown if it doesn't reverse this week, and remember this has largest weighting in the S&P 500, so could affect market sentiment if it does complete the breakdown.
 

Attachments

  • AAPL_W_5-1-15.png
    AAPL_W_5-1-15.png
    22.7 KB · Views: 204
  • AAPL_D_5-1-15.png
    AAPL_D_5-1-15.png
    25.7 KB · Views: 252
Or the trend was broken in August, the range was tested in November, and the breakdown is already in effect.

Db
 
Or the trend was broken in August, the range was tested in November, and the breakdown is already in effect.

Db

Yep, it broke down into Stage 4A in the August Breakdown, but is now testing support for the full breakdown into the major Stage 4 phase.
 
One does of course have the option of shorting the breakdown and using the break of the last swing low as confirmation. If it isn't confirmed, he's still out with a profit. If it is confirmed, he's ahead of the pack.

Db
 
Pets.l

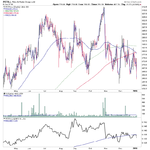
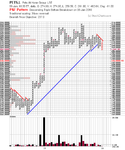
PETS.L - Attempting to make a Stage 4A breakdown after an initial failed attempt in November.
 

Attachments

  • PETS-L_W_6-1-16.png
    PETS-L_W_6-1-16.png
    19.8 KB · Views: 364
  • PETS-L_D_6-1-16.png
    PETS-L_D_6-1-16.png
    31.5 KB · Views: 370
  • PETS-L_P_6-1-16.png
    PETS-L_P_6-1-16.png
    28.8 KB · Views: 326
S&P 1500 Cumulative P&F Breakouts - Breakdowns Charts

Attached is the up to date S&P 1500 Cumulative P&F Breakouts - Breakdowns charts, which clearly shows the bearish trend currently with over 26% of the S&P 1500 having P&F breakdowns since the start of the new year.
 

Attachments

  • SP1500_BO-BD_50MA_7-1-16.png
    SP1500_BO-BD_50MA_7-1-16.png
    16.9 KB · Views: 300
  • SP1500_BO-BD_20MA_7-1-16.png
    SP1500_BO-BD_20MA_7-1-16.png
    18.8 KB · Views: 256
  • SP1500_BO-BD_10MA_7-1-16.png
    SP1500_BO-BD_10MA_7-1-16.png
    23.6 KB · Views: 288
  • Oscillator_SP1500_BO-BD_7-1-16.png
    Oscillator_SP1500_BO-BD_7-1-16.png
    26.2 KB · Views: 321
  • Cum_SP1500_BO-BD_7-1-16.png
    Cum_SP1500_BO-BD_7-1-16.png
    23.3 KB · Views: 323
  • SP1500_BO-BD_200MA_7-1-16.png
    SP1500_BO-BD_200MA_7-1-16.png
    11.2 KB · Views: 229
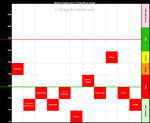
US Sector Breadth and Percentage of stocks above their 150 day MA charts

Attached is the US Sector Breadth visual diagram showing the current snapshot of the market and the corresponding NYSE and Nasdaq Percentage of stocks above their 150 day MA charts.
 

Attachments

  • 105_sector-breadth-visual_8-1-16.png
    105_sector-breadth-visual_8-1-16.png
    16 KB · Views: 562
  • NYA150R_com_8-1-16.png
    NYA150R_com_8-1-16.png
    42.6 KB · Views: 327
  • NAA150R_com_8-1-16.png
    NAA150R_com_8-1-16.png
    45.1 KB · Views: 314
Stage Analysis Thread

The Stage Analysis thread where I do most of my posting thesedays has been updated to include all of the market breadth data that I post each week on the US markets. The thread can be found here: http://stageanalysis.net/forum/forumdisplay.php?fid=2

And the US and UK Stage Analysis watchlist threads have been simplified into single threads also, to make it easier for people to find the content that interests them the most.

Cheers
 
UK Advance Decline Line chart

UK Advance Decline Line chart
 

Attachments

  • LOAD_cum_29-1-16.png
    LOAD_cum_29-1-16.png
    50.9 KB · Views: 283
UK Charts

Attached is the weekly and monthly major UK index charts
 

Attachments

  • FTSE_AIM_29-1-16.png
    FTSE_AIM_29-1-16.png
    52.8 KB · Views: 273
  • FTSE250_29-1-16.png
    FTSE250_29-1-16.png
    58.2 KB · Views: 301
  • FTSE100_29-1-16.png
    FTSE100_29-1-16.png
    58.3 KB · Views: 289
Gold monthly charts

Gold monthly charts in Dollars, Euros and Pounds
 

Attachments

  • $GOLD_M_29-1-16.png
    $GOLD_M_29-1-16.png
    45.4 KB · Views: 311
Major US Stock Indexes Update - NYSE, Nasdaq, S&P 500

Here's a quick overview of the the major US weekly charts including the Bullish Percent and Moving Average Breadth below each.

Note: All three are close to the tops of their developing Stage 1 ranges, and so there's a possibility of an early Stage 2A breakout attempt in the next week or so.
 

Attachments

  • NYSE_W_27-5-16.png
    NYSE_W_27-5-16.png
    50.5 KB · Views: 265
  • COMPQ_W_27-5-16.png
    COMPQ_W_27-5-16.png
    46.2 KB · Views: 309
  • SPX_W_27-5-16.png
    SPX_W_27-5-16.png
    51.3 KB · Views: 272
Major US Stock Indexes Update - NYSE, Nasdaq, S&P 500

Here's the quick overview charts of the US Bullish Percent and Moving Average Breadth.

Note: The S&P 500 made a Stage 2 breakout this week, and the NYSE and Nasdaq Composite charts are both just under their breakout levels.
 

Attachments

  • NYSE_W_8-7-16.png
    NYSE_W_8-7-16.png
    50.6 KB · Views: 255
  • COMPQ_W_8-7-16.png
    COMPQ_W_8-7-16.png
    47.1 KB · Views: 263
  • SPX_W_8-7-16.png
    SPX_W_8-7-16.png
    51.5 KB · Views: 268
Back
Top