Stan Weinstein's Stage Analysis

Fair comment ISAtrader, this is already one of the "cleanest" and most focused on topic threads on T2W and that idea should help keep it that way.

Having said that, I can't think of one chart which would have supported my comment on the outcome of the fiscal cliff deliberations being of significant importance to the future direction of the markets.

It's a "known unknown" so I guess the point of Weinstein's approach is that potential blackswan events like this happen all the time but that it's all in the tape. So using the method you should ignore the headlines and opinions, and simply focus on what the overall weight of evidence from the various charts is telling you to determine your positioning.
 
It's a "known unknown" so I guess the point of Weinstein's approach is that potential blackswan events like this happen all the time but that it's all in the tape. So using the method you should ignore the headlines and opinions, and simply focus on what the overall weight of evidence from the various charts is telling you to determine your positioning.

Yes, elliottwave principle holds this to be true also but obviously using a different method i.e. a wave structure. Correct me if I'm wrong but the weight of evidence appears to be on the downside for the US indices. In that case the most probable outcome is a continuation of bearish price action and supporting indicators and market internals. So perhaps the charts are telling us that a bear market is on the cards regardless of the out come of the fiscal cliff negotiations. I can accept this because of my macro beliefs regarding the deflation/inflation argument. "The tape tells all" as with any profitable trading method sticking to rules is the key to success.
 
...Correct me if I'm wrong but the weight of evidence appears to be on the downside for the US indices. In that case the most probable outcome is a continuation of bearish price action and supporting indicators and market internals. So perhaps the charts are telling us that a bear market is on the cards regardless of the out come of the fiscal cliff negotiations. I can accept this because of my macro beliefs regarding the deflation/inflation argument. "The tape tells all" as with any profitable trading method sticking to rules is the key to success.

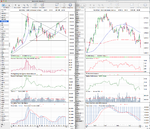
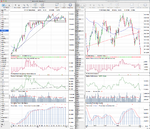
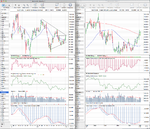
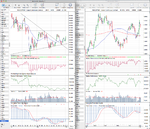
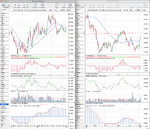
Yes I'd agree that the weighting has shifted back towards the bearish case from the market internals and we are in Stage 3 for the broad US stock market (NYSE and S&P 500), Stage 3B for the Dow Industrials and Stage 4 for the Nasdaq 100. US Treasuries however are also in Stage 3B and the Dollar Index is in Stage 4B imo. So the price action is in a neutral / negative posture going into the New Year which would suggest (depending on your trading timeframe) to either stand aside if you're using the investor method - as you should only buy in late Stage 1 or early Stage 2 generally. Or if you're using the trader method to be both long and short in the strongest and weakest sectors/regions, with more weighting towards the short side imo. But that's just my opinion of what I believe the weight of evidence is currently suggesting for US markets. As Weinstein has said, it's all about probabilities at the end of the day. You'll get whipsawed occasionally, but if you focus on the higher probability trades then you'll come out ahead over the long run.
 
So I spent this holiday season reading Stan's book for the 3rd time in 1 1/2 years, cover to cover.

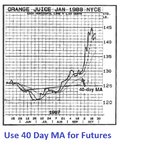
A huge takeaway for me was how Stan trades futures contracts using not the 150 day MA but the 40 day! Yes the 40 day for stage analysis! (see page 330-333)

IT'S NO DIFFERENT WHEN DEALING WITH THE FUTURE(S)

"The final area where you can put it to use is with futures contracts. With a slight alteration in the method (you need a shorter time frame and moving average), you can do amazingly well with any
of the futures contracts, be it orange juice or stock index futures."

"If you want to play investor, then you could stay with the
contract as long as it remained above the 40-day MA (dotted line)
on Chart 9-12."
 

Attachments

  • Stan-futures.jpg
    Stan-futures.jpg
    151.1 KB · Views: 380
So I spent this holiday season reading Stan's book for the 3rd time in 1 1/2 years, cover to cover.

A huge takeaway for me was how Stan trades futures contracts using not the 150 day MA but the 40 day! Yes the 40 day for stage analysis! (see page 330-333)

IT'S NO DIFFERENT WHEN DEALING WITH THE FUTURE(S)

"The final area where you can put it to use is with futures contracts. With a slight alteration in the method (you need a shorter time frame and moving average), you can do amazingly well with any
of the futures contracts, be it orange juice or stock index futures."

"If you want to play investor, then you could stay with the
contract as long as it remained above the 40-day MA (dotted line)
on Chart 9-12."

I do remember that from the past when I read the book the first few times. However, it was a very small mention in the book of just a few pages near the end and I haven't seen it referenced in any of the GTA reports I've read, as they always show the daily charts with the 50 day SMA and 200 day SMA. To be honest there isn't a huge difference between the 40 day and 50 day MAs, except for it being slightly faster. So it may be useful for when a commodity is going parabolic, but a trendline would probably do just the same in terms of getting you out earlier when the momentum is waning, or even a weighted or exponential 50 day MA. To me the 30 week MA, the 50 day and 200 day moving averages are most helpful in determining the stages as I like to look at both charts at the same time, which then makes it fairly easy to determine the current stage. I think the 40 day MA could possibly be another part of the method that has been dropped over the years since the book was written, but that's just speculation on my part, so you should obviously test it for yourself to see if there's any added value for short term futures trades.
 
Watchlist - Monthly Charts

I'm thinking of getting back into my ISA over the coming year with some investor positions in some UK stocks. So attached is an initial watchlist of monthly charts of UK stocks making big Stage 1 bases and in a few cases already breaking out. I haven't been through that many charts yet as I came across a few randomly and then decided to be more systematic and went alphabetically. So I'm only up to D in the FTSE 350. Remember these are monthly charts, so are much more long term.
 

Attachments

  • NTG_L_Monthly_31_12_12.png
    NTG_L_Monthly_31_12_12.png
    55.2 KB · Views: 300
  • AV_L_Monthly_31_12_12.png
    AV_L_Monthly_31_12_12.png
    59.6 KB · Views: 290
  • BBA_L_Monthly_31_12_12.png
    BBA_L_Monthly_31_12_12.png
    59.9 KB · Views: 273
  • BDEV_L_Monthly_31_12_12.png
    BDEV_L_Monthly_31_12_12.png
    53.5 KB · Views: 291
  • BLND_L_Monthly_31_12_12.png
    BLND_L_Monthly_31_12_12.png
    56.5 KB · Views: 266
  • BWY_L_Monthly_31_12_12.png
    BWY_L_Monthly_31_12_12.png
    60.1 KB · Views: 286
  • BYG_L_Monthly_31_12_12.png
    BYG_L_Monthly_31_12_12.png
    58.3 KB · Views: 304
  • DEB_L_Monthly_31_12_12.png
    DEB_L_Monthly_31_12_12.png
    52.6 KB · Views: 306
Great update p92 as usual, isatrader.
Russell 2000 highs to be hit today IWM - weekly - StockCharts.com

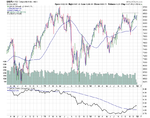
Thanks lplate and happy new year. The broad New York Stock Exchange chart ($NYA) will be testing the top of it's Stage 3 range as well today. So it is going to be interesting to see how this week goes and whether the likely breakout today holds or is a blow off top, as the last few days rally has been on very light volume. So personally I'm going to be watching the volume price action relationship closely.

attachment.php
 

Attachments

  • NYA_Weekly_31_12_12.png
    NYA_Weekly_31_12_12.png
    32.7 KB · Views: 1,393
Last edited:
I do remember that from the past when I read the book the first few times. However, it was a very small mention in the book of just a few pages near the end and I haven't seen it referenced in any of the GTA reports I've read, as they always show the daily charts with the 50 day SMA and 200 day SMA. To be honest there isn't a huge difference between the 40 day and 50 day MAs, except for it being slightly faster. So it may be useful for when a commodity is going parabolic, but a trendline would probably do just the same in terms of getting you out earlier when the momentum is waning, or even a weighted or exponential 50 day MA. To me the 30 week MA, the 50 day and 200 day moving averages are most helpful in determining the stages as I like to look at both charts at the same time, which then makes it fairly easy to determine the current stage. I think the 40 day MA could possibly be another part of the method that has been dropped over the years since the book was written, but that's just speculation on my part, so you should obviously test it for yourself to see if there's any added value for short term futures trades.

I found more evidence in the book that Stan recommends shorter moving averages for commodity futures and stock index futures (whether you chose 40-day or 50-day MA period is a personal choice)

Here's a quote from the book on futures:

"Just be aware that when dealing with commodities or stock index futures that the time frame is speeded up considerably, and a Stage 2 advance may unfold in
a matter of weeks instead of months. So you'll need to use a much shorter-term MA." - Stan Weinstein - pg 55

I've been reviewing several commodities using the 40-day MA daily charts for futures and its working amazing. You use the slope of the 40-day MA to determine the stage...NOT the 150MA....and I'm seeing some extraordinary signals. I'll post some in a future post.

Happy Trading!
 
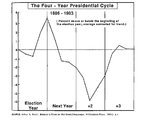
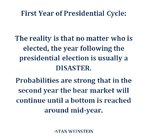
Welcome to 1st year of presidential cycle.

100 years of data show this to be either a BEAR year or the year with the lowest returns of the 4 year cycle.

Here's the chart out of Stan's book.

Get ready, 2013 could be very bumpy ride.

Cheers!
 

Attachments

  • 4 YEAR PRESIDENTIAL CYCLE.jpg
    4 YEAR PRESIDENTIAL CYCLE.jpg
    113.2 KB · Views: 409
  • 1st year presidental cycle.jpg
    1st year presidental cycle.jpg
    142.8 KB · Views: 331
Watchlist - Monthly Charts

To continue on from my post earlier in the week, here's another bunch of monthly UK stock charts that are either making large Stage 1 bases or have moved into early Stage 2 on a monthly basis. These are for a watchlist for a potential pick for my ISA soon.
 

Attachments

  • CHU_L_Monthly_3_1_13.png
    CHU_L_Monthly_3_1_13.png
    60.4 KB · Views: 340
  • DCG_L_Monthly_3_1_13.png
    DCG_L_Monthly_3_1_13.png
    61.6 KB · Views: 271
  • FCAM_L_Monthly_3_1_13.png
    FCAM_L_Monthly_3_1_13.png
    56.2 KB · Views: 298
  • GKN_L_Monthly_3_1_13.png
    GKN_L_Monthly_3_1_13.png
    62.3 KB · Views: 222
  • GNK_L_Monthly_3_1_13.png
    GNK_L_Monthly_3_1_13.png
    58.2 KB · Views: 304
  • ICP_L_Monthly_3_1_13.png
    ICP_L_Monthly_3_1_13.png
    55.8 KB · Views: 305
  • HMSO_L_Monthly_3_1_13.png
    HMSO_L_Monthly_3_1_13.png
    56.8 KB · Views: 297
  • GPOR_L_Monthly_3_1_13.png
    GPOR_L_Monthly_3_1_13.png
    58.7 KB · Views: 330
ISATrader. I am wondering where you show your 4 year support trendline coming in for spot silver? I wanted to compare. News out this afternoon in the states that FED is considering following the UK in stopping QE this year mid year or by year end. Headlines everywhere and the metals (gold & silver) plunging.....Silver futures down over 4% as I write this...breaking multi-month support.

What level are you showing is the "official" break of that 4 year trendline for silver?

Thanks
 
ISATrader. I am wondering where you show your 4 year support trendline coming in for spot silver? I wanted to compare. News out . . .
silver has been sideways for 18 months so is not of interest.
$SILVER - SharpCharts Workbench - StockCharts.com
Suggest you reread book, and summarise its simple rules in 5 sentences and stick to those, instead of getting distracted by all these side issues. To discuss side issues, go to other threads, following example of isatrader on market breadth etc
 
I believe Isatrader is using a Mac app to do his research, but I just wondered what other people are using ? I currently use Sharescope on PC but (a) it's overpowered for Weinstein's method and (b) it doesn't carry US sector indices, so I'm looking to move to a (preferably online) alternative.

Any suggestions ?

A few online charting programs that myself and other people on that have posted on the thread use are stockcharts, FreeStockCharts, and prorealtime. Although I'm not sure if prorealtime has the US sectors. But the first two do. I use the paid for "Extra" service on stockcharts, as it gives you more options on the charts like overlaying a moving average on the relative performance indicator to make it into the Mansfield RS from Weinstein's method, as the 52 week MA of the relative performance versus the S&P 500 is the zero line. But they have a 10 day free trial, so you can see if you like it or not.

For non online options as you noted I'm using a Mac so I use ProTA Gold which is an EOD program, and another member uses MetaStock, and between us we managed to get it setup in the same way as the charts I post on here.
 
Last edited:
A few online charting programs that myself and other people on that have posted on the thread use are stockcharts, FreeStockCharts, and prorealtime. Although I'm not sure if prorealtime has the US sectors. But the first two do.

Thanks, much appreciated.
 
Last edited:
ISATrader. I am wondering where you show your 4 year support trendline coming in for spot silver? I wanted to compare...

For the trendline drawn as Weinstein suggested in the technically speaking interview, it comes in at around the $29 level. But a bit a lower if you use the weekly closing data like I prefer. But I've attached the chart using the ultimate lows for you. A few things to remember with Silver. It has a strong correlation with Gold, over 90%, so always watch Gold when trading Silver as it's support and resistance levels will affect Silver too. The overnight move in the Gold (GC) and Silver (SI) futures has given them a potential continuation move in their early Stage 4 declines. However, Non Farm Payrolls is today and comes out when the Gold/Silver pit session begins (13.30pm GMT, 8.30am EST) and so it's not wise to do anything before that's been absorbed by the market imo, as they have volatile sessions on NFP days.

I know you are already in the Silver trade, so I'll just repeat what I said before, which is that although short term Silver and Gold are in Stage 4, they are both still within a much larger Stage 3 / 1 range and are approaching strong near term horizontal resistance which has held multiple times. So just be aware of where the support levels are.

As lplate said, to talk in more detail and actively about it with Silver and Gold day traders there's some good side threads like: http://www.trade2win.com/boards/commodities/124202-silver-27.html#post2039380 and http://www.trade2win.com/boards/commodities/164370-gold-2013-lack-lustre-year.html#post2046544 and member YouAreNotFree is the active Silver day trader on the boards that knows the market well imo.
 

Attachments

  • SI_Weekly_4_1_13.png
    SI_Weekly_4_1_13.png
    133.7 KB · Views: 315
  • GC_Weekly_4_1_13.png
    GC_Weekly_4_1_13.png
    134.1 KB · Views: 339
Last edited:
For the trendline drawn as Weinstein suggested in the technically speaking interview, it comes in at around the $29 level. But a bit a lower if you use the weekly closing data like I prefer. But I've attached the chart using the ultimate lows for you. A few things to remember with Silver. It has a strong correlation with Gold, over 90%, so always watch Gold when trading Silver as it's support and resistance levels will affect Silver too. The overnight move in the Gold (GC) and Silver (SI) futures has given them a potential continuation move in their early Stage 4 declines. However, Non Farm Payrolls is today and comes out when the Gold/Silver pit session begins (13.30pm GMT, 8.30am EST) and so it's not wise to do anything before that's been absorbed by the market imo, as they have volatile sessions on NFP days.

I know you are already in the Silver trade, so I'll just repeat what I said before, which is that although short term Silver and Gold are in Stage 4, they are both still within a much larger Stage 3 / 1 range and are approaching strong near term horizontal resistance which has held multiple times. So just be aware of where the support levels are.

As lplate said, to talk in more detail and actively about it with Silver and Gold day traders there's some good side threads like: http://www.trade2win.com/boards/commodities/124202-silver-27.html#post2039380 and http://www.trade2win.com/boards/commodities/164370-gold-2013-lack-lustre-year.html#post2046544 and member YouAreNotFree is the active Silver day trader on the boards that knows the market well imo.

Thanks IsaTrader, you are a great help to us all.
 
US Industry Sectors

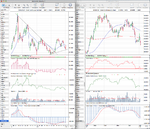
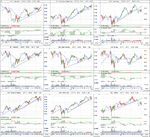
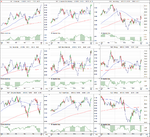
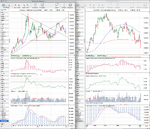
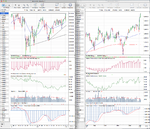
Attached is the updated US Industry Sector charts and the relative performance table. The massive reversal over the thin volume New Year period has caused some notable changes to the sector charts with four of the nine sectors breaking above their Stage 3 ranges to start potential Stage 2 continuation moves. They are Financials (XLF), Basic Materials (XLB), Industrials (XLI), and Consumer Discretionary (XLY). Technology (XLF) broke above it's three month Stage 4 pattern and moves back into Stage 1A imo. Whereas Energy (XLE), Consumer Staples (XLP) and Health Care are still in Stage 3B, but note that Energy broke above it's recent swing high, and Utilities is still the laggard in Stage 4B- imo. So a very different overall picture to what we saw last week.
attachment.php
 

Attachments

  • US_Industry_Sectors_4_1_13.png
    US_Industry_Sectors_4_1_13.png
    124 KB · Views: 260
  • US_Industry_Sectors_D_4_1_13.png
    US_Industry_Sectors_D_4_1_13.png
    124.2 KB · Views: 307
  • US_Industry_Sectors_list_4_1_13.png
    US_Industry_Sectors_list_4_1_13.png
    21.4 KB · Views: 1,171
Last edited:
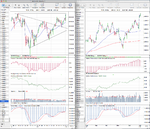
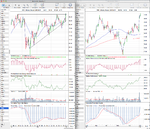
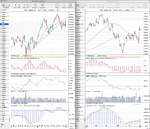
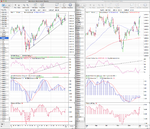
Attached is the updated major charts for your own stage analysis and the relative performance table.

attachment.php


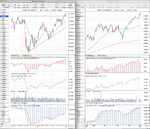
This week saw the German Dax and the Russell 2000 break out to new highs. The Dax also continues to be the strongest on the relative performance table versus the S&P 500, although it was briefly knocked off last week by the VIX which has plummeted to the bottom spot this week, highlighting the extreme move we've had. There was also breakouts to 52 week highs for the FTSE 100 and the NYSE indexes, but both are now approaching resistance from their 2011 highs.

The Nasdaq 100 is the weakest of the indexes, but it's good to see the Nasdaq 100 move up the relative performance table a few places as it's been near the bottom for a long time now. This weeks move saw it break above it's 30 week WMA and the 200 day MA, and also the swing high of the recent range. So I now consider it to be back in Stage 1A.

The S&P 500 is moving up to challenge it's September 2012 high of 1474.51 after reversing above it's trendline for the 5th time and the 30 week MA momentum has also turned positive again. The short term moving average breath chart shows that 89.80% of stocks in the S&P 500 are above their 50 day moving average. That's 449 of the 500 stocks, and so it's at an extreme reading in the short term. I have it as in Stage 3 still, as it would need to make new highs to make a Stage 2 continuation move imo.
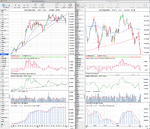
The Dollar Index moved strongly from the lower part of it's range that's been developing for the last four months since it's Stage 4 breakdown failed to break below the previous support from the beginning of 2012. It closed above it's 50 day MA, but below a still declining 50 week WMA, and so although there is a clear range developing, it is not yet "officially" in Stage 1A, and so I have it as Stage 4B- currently.
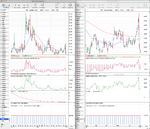
US Treasuries were probably the most interesting charts of the week imo, as they tried to break down below critical horizontal support at the bottom of their major Stage 3 ranges, but had a strong volume reversal on Fridays session to close above the breakdown levels. And so it will very important to monitor these in the coming week as if they hold support the stock indexes will pullback. But if they fail and breakdown significantly, then we could see the continuation moves in the stocks power onwards for a while. So I think these Treasury charts are key in the coming week.

I've also updated the market breadth thread for those that are interested in determining what the weight of evidence is currently suggesting from the market internals. Here's the link: http://www.trade2win.com/boards/technical-analysis/147476-market-breadth-23.html#post2047474
 

Attachments

  • DAX_Weekly_4_1_13.png
    DAX_Weekly_4_1_13.png
    137.9 KB · Views: 236
  • NYA_Weekly_4_1_13.png
    NYA_Weekly_4_1_13.png
    136.4 KB · Views: 274
  • IWM_Weekly_4_1_13.png
    IWM_Weekly_4_1_13.png
    130.7 KB · Views: 311
  • NDX_Weekly_4_1_13.png
    NDX_Weekly_4_1_13.png
    140 KB · Views: 276
  • SPX_Weekly_4_1_13.png
    SPX_Weekly_4_1_13.png
    148.6 KB · Views: 240
  • TY_10yr_Treasuries_4_1_13.png
    TY_10yr_Treasuries_4_1_13.png
    136.4 KB · Views: 292
  • CL_Weekly_4_1_13.png
    CL_Weekly_4_1_13.png
    140.1 KB · Views: 245
  • HG_Weekly_4_1_13.png
    HG_Weekly_4_1_13.png
    135.6 KB · Views: 301
  • GC_Weekly2_4_1_13.png
    GC_Weekly2_4_1_13.png
    131.2 KB · Views: 255
  • FTSE100_Weekly_4_1_13.png
    FTSE100_Weekly_4_1_13.png
    144.6 KB · Views: 286
  • US_30yr_Treasuries_4_1_13.png
    US_30yr_Treasuries_4_1_13.png
    135.1 KB · Views: 283
  • DX_Weekly_4_1_13.png
    DX_Weekly_4_1_13.png
    133 KB · Views: 291
  • VIX_Weekly_4_1_13.png
    VIX_Weekly_4_1_13.png
    130.3 KB · Views: 214
  • Major_Charts_RS_list_4_1_13.png
    Major_Charts_RS_list_4_1_13.png
    25.1 KB · Views: 1,201
Last edited:
Back
Top