Sniper Forex System

We will have to see how the resistance does at 1.6360. 1.6380 has been breached and I expect 1.6360 also. Now setting at 25 pips profit on cable.
Kent
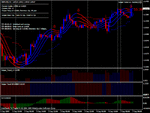
That fell a bit quicker than I expected! I was looking at a more gentle fall, hitting the 61.8 Fib to coincide with hitting the resistance set by lows on the 2nd and 4th September. It hasn't hit that resistance yet.
Since I posted the graph, the candle is now sitting on the Bollinger MA, It's poked through the 61.8 Fib, but retracted. Half way through this hour now, I will wait for the close of this candle as it could well turn up from here.
One of the sniper lines is red now. If at candle close they are all blue again, I will seriously consider taking the Sniper long. Time will tell 🙂
 

Attachments

  • pound.gif
    pound.gif
    36.9 KB · Views: 270
Last edited:
Thanks Kent, apreciate your suggestions for looking at others working on EW...

Please find attached a file I recently found somewhere - it's like a condensed theory of EW to stick on your computer... I don't know much of EW really so don't know also if it is of some value or not... Please advise. Thanks!

Jerry

Jerry,
That is pretty cool. I may have to print it out. As stated on the cheat sheet, there are only 3 rules to EW. But there are a good many guidelines. Even with just 3 rules it takes a little while to get your head around the counts. One of the biggest things that I have found to help me with the counts of the waves, is to use a line chart. Really makes things clearer.
Regards,
Kent
 
Here's the image I was referring to in the second part of my last post.
Sorry about that. I was referring to my live graph, when I had already posted a graph 10 minutes or so out of date.
 

Attachments

  • pound 2.gif
    pound 2.gif
    32.7 KB · Views: 159
That fell a bit quicker than I expected! I was looking at a more gentle fall, hitting the 61.8 Fib to coincide with hitting the resistance set by lows on the 2nd and 4th September. It hasn't hit that resistance yet.
Since I posted the graph, the candle is now sitting on the Bollinger MA, It's poked through the 61.8 Fib, but retracted. Half way through this hour now, I will wait for the close of this candle as it could well turn up from here.
One of the sniper lines is red now. If at candle close they are all blue again, I will seriously consider taking the Sniper long. Time will tell 🙂

I would really think twice about going long on this. There is an a-b-c correction going on right now that should take it to around 1.6266. I think a long trade would be a disaster. But that is my opinion. I could be wrong. There will be a turn long, but it will probably be brief. Let your gut be your guide. I really dont want to look like a know it all, but i feel really strong about this. Be better to wait it out. I have gone short, but on demo. I am not risking any capital on this move. We are looking at reduced liquidity, with the US holiday. Well, I am going to bed. Goodnight, all.
Kent

I agree that shorts are more probable at the moment. Looking at the H4 trendlines we can see that we are approaching lower TL and we could see a bounce at around 1.6270 - so we can expect a nice 90 pips move. At the same time I am looking at negative divergence on M15 telling me shorts are here also...

I will not trade today though due to the US holiday - although I don't understand why volumes today would be low since the rest of the world is trading anyway... Any comments on that?
 
No reason why anyone should be upset by your comments.
I don't know if other systems are better at identifying entry and exit points - I haven't tried anything else.
All analysis that attempts to identify an established trend is going to be behind the times. This systems seems good enough at finding entry levels most of the time.
I totally agree with you that the exit strategy leaves a lot to be desired. I don't like the fact that there is no target price. The stoploss really has no relationship with the trade as far as I can see.
Early days yet for me with this system, but I'm sure that using historical support/resistance, fibonacci levels and of course Elliot Waves (if I could spot them!) may do a better job for fixing target levels, stoplosses etc.

Same here - I agree that exits are the problem with this strategy and have been discussed already in this forum, but I believe they still need to be studied more.

I have just found a great document about stops which is attached. In the document a possibility to close part of the trade when 2:1 reward risk ratio is reached is discussed confirming my idea from before. I am still considering other options including Chandelier Stops which seem very interesting.

Maybe we could be closing half of the position at 2:1 reward risk ration and the other half using tighter stops maybe based on ATR (FYI Sniper Stops are also based on ATR...) let's say 2*Atr(10)...

Jerry
 

Attachments

I would really think twice about going long on this. There is an a-b-c correction going on right now that should take it to around 1.6266. I think a long trade would be a disaster. But that is my opinion. I could be wrong. There will be a turn long, but it will probably be brief. Let your gut be your guide. I really dont want to look like a know it all, but i feel really strong about this. Be better to wait it out. I have gone short, but on demo. I am not risking any capital on this move. We are looking at reduced liquidity, with the US holiday. Well, I am going to bed. Goodnight, all.
Kent

Don't worry, the hour candle just closed and there is, as yet nothing to indicate that it is a feasible long. I will be biding my time and let the market tell me when the time is right.
This is a good example of why it is best not to rush into a deal. It moved down, tested resistance and started to move up again. In situations like this, wait for the candle to close to tell a fuller story.
I still see this as a possible long, but will wait for an hour or 2 before making any real decision.
I see 2 red sniper lines on the chart now and 1 red sniper trend Histo, so maybe Sniper will be calling a short soon.
 
The other thing I wanted to add about Sniper System is that I think it was invented to be simple system with little indicators and easy to be used also by novice traders. Adding complicated indicators, divergences, lower timeframes or EW was not intended exactly because of that reason - it complicates the system and people like to buy systems that are easy to use...

I am not saying that we should not be adding other confirmations for entries or different exit strategies - on the contrary this I believe is the intention of this thread and our expectations from it - just wanted to present my idea why the system is as-it-is - developed to be simple and easy to sell.

And last but not least - I still believe the system should be as easy as possible, since adding more indicators does not add substantially to its profitability. What sest apart profitable traders from loosing ones is positions sizing, money management and exits! Have these under control and you are on the safe side with almost any system - even blindly picking up the currency and direction...

Jerry
 
Last edited:
we have a sniper long signal !

That is very interesting fx eagle.
I have seen arrows appear and disappear many times, but this is the first evidence I have seen of an all systems go entry signal, that subsequently disappears!
I suspect that if you change your chart to a different timeframe and then back to H1, you will no longer see the arrow.
That was a proper alert with everything matching, so it was a valid entry. But you were possibly the only person to see it!

yep, you right on my desktop it disappears after change the chart timeframe

but I let it run now at a VPS and by the help of pircj, I have an email alerter that give me every entry to my phone, I will see this month all signal, same the author of the system say " don't wait to candle close , open the trade if you have a signal and all indis agree" so I no hassle of disconnection I hope will give me real signal I can check
 
Maybe I have a different version of sniper to you guys but my signals don't disappear and i jump timeframes all day long!

sorry just noticed that your arrow was between 9-10.

ignore my comments.
 

Attachments

  • 6.gif
    6.gif
    46.1 KB · Views: 165
Last edited:
yep, you right on my desktop it disappears after change the chart timeframe

but I let it run now at a VPS and by the help of pircj, I have an email alerter that give me every entry to my phone, I will see this month all signal, same the author of the system say " don't wait to candle close , open the trade if you have a signal and all indis agree" so I no hassle of disconnection I hope will give me real signal I can check

This is not good, it means that Sniper can give full on entry alerts and then erase all record of them!
I see that the next hour timeframe is currently giving an all systems go long signal.
If you have read my earlier posts today, you will see that I was considering going long hours before the signal to go long.
Considering, not opening the trade. The subsequent few hours put me off all idea of going long.
The 7am (UK) candle was a hanging man with a very long rope, Followed by a candle with a long body and the wick poking through bollinger resistance. The next candle a lower high with a small body. Everything about the last few hours screams at me "do not even consider a long - in fact don't consider anything! Turn off your computer and go and do something else!"
Tomorrow is another day and I will take no part of this day.
Anybody who takes this long - I really hope that it works out for you.
My feelings are to stand back from it and take a breather.
Things were looking really good to me earlier with the developing long, but sometimes it's best to wait and see. If you miss a trade, don't worry, there will probably be another one along soon.
 
Maybe I have a different version of sniper to you guys but my signals don't disappear and i jump timeframes all day long!

sorry just noticed that your arrow was between 9-10.

ignore my comments.

Well I see that you have the blue arrow on the chart that you posted
I had the same (first image)
I then refreshed when the price dropped and guess what - another full on entry alert was wiped from memory!
If you refresh now, is that arrow still there?
 

Attachments

  • pound blue arrow.gif
    pound blue arrow.gif
    24.1 KB · Views: 159
  • pound blue arrow gone.gif
    pound blue arrow gone.gif
    24.2 KB · Views: 170
no but the candle is still active, you have to wait till the candle with the signal closes before it is set in stone.
 
no but the candle is still active, you have to wait till the candle with the signal closes before it is set in stone.

Sorry to disagree with you, but the instructions with Sniper clearly state to enter the trade as soon as all conditions are met. It actually states "DO NOT wait until the close of the candle."
 
From my set up guide
We ONLY enter a trade short when ALL THREE trigger lines on the 1hr chart change colour
from blue (Blue arrow) to red (Red arrow) and the histograms below the chart are red. If
you cannot see the arrows on your chart – zoom out. This means that if the histograms are not
red at the time of the arrow, but some time later BOTH are red, then this becomes a valid
trade. Vica-versa for long trades. Do NOT wait until the end of the bar/candle to enter the trade,
enter precisley when all conditions have been met. Enter with the lot size according to your
money management strategy – placing a stop loss 5-10 pips below the most recent blue dot in a
long trade and 5-10 pips above the most recent red dot in a short trade (using the rules for
money management see (19.) below NB!!NB!!) – exit when your trailing stop is hit or ALL 3
indicator lines on the chart change colour. i.e an arrow in the opposite direction is the signal
to exit.
 
Sorry to disagree with you, but the instructions with Sniper clearly state to enter the trade as soon as all conditions are met. It actually states "DO NOT wait until the close of the candle."

This is right GumRai, same I write below alreay !
 
Back
Top