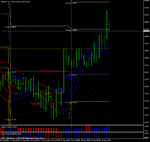
Cool post, I am also considering trading on M15 in the direction of H1 and entering on pullbacks. Entering on pullbacks can be done also on H1 since usually the price retraces after we get a signal. Well, sometimes it doesn't and in this case you can loose a lot of pips...
Please find attached MTF HMA indicator I made to show HMA on levels above your current chart (selectable timeframe - check inputs).
Anyway, please also note that if I miss a signal that occurs sometimes when I am not in front of my computer, I do reenter when price retraces to previous level. Good thing about this is that at that time the Sniper Stop tends to be closer and therefore I risk less.
Have good pips...
Jerry
Sniper variant: !!untested!! (as requested earlier in the day)
reasoning: I trade pullbacks. If HMA channel is optimal setting of 30 for the hourly, then I replicate it in essence, by using 120 on the 15mins.
Since I am a pullback trader, I have added Stochs(12,3,3) onto the chart.
Also, bog standard MACD.
Observations: Since the chart is simply a 15-min proxy for the 60-mins, I can now look for pullbacks.
I effectively ignore Sniper A and B since I dont know what they represent. I only want to use indicators I understand, so I know when to use them, and when to ignore them.
Note now, the stop-loss can be used as a pullback entry.
When the HMAs are 3 blues: take the entry if the price is "close" to the HMAs. This is subjective. If price has run away too far from the Hulls, I would rather not enter, and wait for a pullback.
In an uptrend (3-blues), this can be:
a: Stochs goes Oversold, and hooks up. (anywhere on the histogram)
b: Price falls back to "stop-loss". (blue dots)
In a downtrend (3 reds), entry can be:
a: Stochs going overbought and hooking down.
b: Price rises upto the "stop-loss". (red dots)
Actual stop-loss is also under investigation. Either way, you can reduce your risk exposure by using Price Action, such as the High caused by the Stochs overbought signal in a downtrend, or the Lows caused by the Stochs OS signal. Up to you.
Exits: I have added 0.002 and -0.002 to the MACD. I am only interested when the MACD exceeds 0.002/-0.002 and hooks back. This I am experimenting as an extreme point exit. I use this to take profits, rather than let them slip away.
All of the above is my initial reaction to Sniper. I am a pullback player, so I modified it to meet my personal psychology.
NB: the sample chart shows in essence what I am thinking. I miss moves. And get it wrong. But I can get in at a bargain price. Hope this stimulates some positive discussion. Or gets ignored to the dustbin of pie-in-the-sky fantasies. Either way, I am not fussed. Good trading. 😎
I am likely to miss some moves, but so what, its not my only method.
I dont trade this with real money.
EDIT: chart is actually 120 on hourly. DOH. but you get the point! try the 120 on 15-mins.
EDIT2: just added a proper 15min version. The MACD exits are the more useful bits here.

