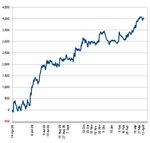
That's my first year with Sniper just completed. That's one year, except for 3 weeks during the Xmas period, 299 trades. It works out at an average of 16.5 pts a (trading) day – 4,014 pts in total. This is trading as per the Sniper rules. It's been pointed out in this thread over the months that trading using the rules isn't as straight forward as it sounds – there's quite a lot of 'playing it by ear.' It works out at 136 wins, 163 losses – 45.5% to 54.5%.
The attached chart shows the points gained and lost as the year progressed. It's clearly a system that needs persevering with. Over a period, it can give some useful gains. But, if someone started mid October, they would be sitting on a loss for most of the next 4 months.
The longest winning run of trades was in June with 6 winners running gaining 682 pts; the 2nd longest with 5 winners in May gaining 430 pts.
The longest losing run of trades was in December with 8 losers running, losing 435 pts; the 2nd longest was in February with 7 losers running, losing 186 pts.
There's been some discussion on the results published on the Sniper website. For the 10 full months involved, my results work out at 66.6% of the official results.
One or two people have said on this thread that these sort of results aren't very impressive. But someone also said – do the maths. 4,000+ points over a year will do me fine.
There's been some useful discussions on this thread on alternative methods using Sniper. The two themes are completely compatible – hopefully we will keep on seeing more.
TP TRADES. My aim here has been to improve on the Sniper additional exit system - exiting at 25 pts, 50 pts, 75 pts, 100 pts and letting the 5th lot ride the trend out. From my spreadsheet results, this would give a result of 15 pts a day, i.e. less than letting the trade run its course. This is an exercise using a spreadsheet (i.e. as a guide, not taking into consideration spreads, different broker prices etc.) The results suggest that a different range of TPs would give better results. The optimum TPs are 160 and 165, both giving 22 pts a day.
The results are – TP at 25 = 12 pts a day, 40 = 14 pts, 45 = 17 pts, 50 = 17 pts, 55 = 16 pts, 60 = 16 pts, 65 = 15 pts, 70 = 14 pts, 75 = 15 pts, 80 = 15 pts, 85 = 16 pts, 90 = 16 pts, 95 = 15 pts, 100 = 15 pts, 105 = 17 pts, 110 = 18 pts, 115 = 20 pts, 120 = 20 pts, 125 = 19 pts, 130 = 20 pts, 135 = 20 pts, 140 = 20 pts, 145 = 19 pts, 150 = 19 pts, 155 = 21 pts, 160 = 22 pts, 165 = 22 pts, 170 = 21 pts, 175 = 20 pts.
It's interesting to note that a 45TP would give a slightly better result than letting the trade run its course.
At the moment I take out 2 trades (2 different brokers), one trade divided into 5 = TPs 45, 100, 115, 160 and the 5th letting the trade run its course. (The second trade is similar, adjusting TPs based on recent average daily ranges.). From the last year, this would give a gain of 18.1 pts a day. Obviously, using this over the next week, month, year will probably result in something completely different! It's something I'm experimenting with all the time.
What I want now is for someone to come up with some data using GBPJPY1hr and EURJPY1hr.


