Db,
When trading shorter time frames, 30 min, 15 and 5, I assume you still take longer term time frames into account? A very good short or long trade can look great until do span out into longer frames. How much confluence do you look for if it's overbought on the 30 min but undersold on the daily?
By "time frame" I assume you mean bar interval. 30m is a bar interval, unless all your trading begins and ends within a 30m time span. My time frame is five years. The daily bar within that time frame provides the cue. The trade is then managed via the hourly.
Within the hourly, the bar interval is irrelevant given that all charts are tick charts. What matters is the continuity of price, not how one chooses to view it. If he is not in a position to view it, daytrading is not an option. If you have the book, see "Continuity of Price" in
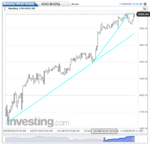
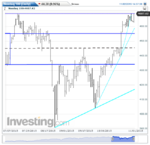
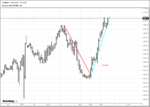
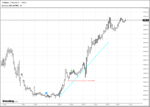
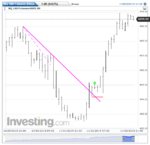
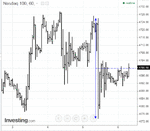
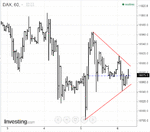
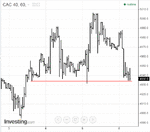
Notes, p. 18. As for using the daily as a cue, see "Trading Opportunities", p. 49 (Friday's trade is also an example and I'll probably include it in the book this winter).
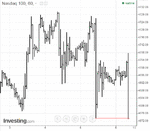
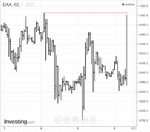
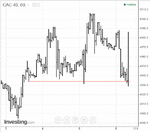
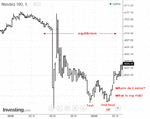
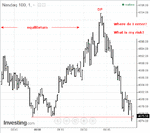
As for moving from shorter bar intervals to longer, you have it reversed. Weekly>Daily>Hourly. Those who are in a position to move price trade weekly and daily intervals, not intraday. The task is to understand what they're doing and follow them. Friday, again, is a good example of this.
"Overbought" refers to whether and how much price has become extended through the upper limit of a trend channel or range. I don't know what "undersold" means. As long as the Danger Point (p. 65) is holding, the trade is left alone until price has changed stride. Changing and reversing stride is addressed in the pdf I posted at the beginning of the other thread.
Db

