SLAyers' Notes

Status
Not open for further replies.
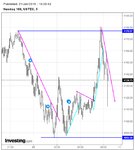
Double top/dog on the hourly on yesterdays high, this move down possibly a ret after the supply line is broken. Long almost triggered on the 1 minute time frame.

Not sure how people feel about trading this close to the open though.
 

Attachments

  • nq2101201660min.png
    nq2101201660min.png
    28 KB · Views: 190
  • nq210120161min.png
    nq210120161min.png
    26.5 KB · Views: 213
Double top/dog on the hourly on yesterdays high, this move down possibly a ret after the supply line is broken. Long almost triggered on the 1 minute time frame.

Not sure how people feel about trading this close to the open though.

My long was triggered but didn't pan out. BE. Until we clear 43, I'll watch and wait.

Db
 
Me too, but not so much bec of the change in trend but bec of the resistance to declining.

Db

Yes Db. That's what I meant as well. Change in the current down trend to the upside might get a heads up by looking at XOM as it's not declining.
 
Yes Db. That's what I meant as well. Change in the current down trend to the upside might get a heads up by looking at XOM as it's not declining.

It's going to be a while, regardless. But at least this gives the informed trader context when he's reading the nonsense posted in the financial press.

Db
 
This is the median as I see it. No desire to try my luck around here. A faster and more engaging person may find it enticing but it's not for me.

Gringo

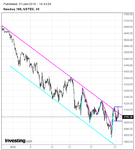
p.s Adding the hourly for perspective.
 

Attachments

  • NQ 05 min.png
    NQ 05 min.png
    32.2 KB · Views: 235
  • NQ hourly.png
    NQ hourly.png
    40.6 KB · Views: 218
Last edited:
Intraday.

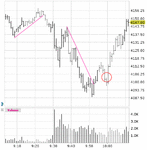
Long failed at the MP of the drop, DL broken with RET on the open which might be a tough call.
 

Attachments

  • nq210120161mina.png
    nq210120161mina.png
    29.9 KB · Views: 221
Has anyone noticed that price has closed the last 5 days(MLK day included) within 17 points. Price has gone nowhere. It has swung 280 points during those 5 days but all closes are within 17 points. Every day's volume (except MLK day of course) has been much above average. Just an observation.
 
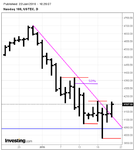
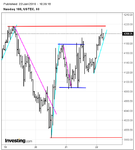
Daily and hourly. There's demand today. Price is approaching a swing high, visible on the daily and the hourly (red). As EldnitJ has mentioned the closes have been close to each other. The swing highs and lows around the closes have been wide. To me it shows a kind of equilibrium around which price is gyrating, more like a trading range of sort. Currently my focus is on the last swing high on the daily.

Gringo
 

Attachments

  • NQ Daily.png
    NQ Daily.png
    28 KB · Views: 146
  • NQ Hourly.png
    NQ Hourly.png
    29.3 KB · Views: 172
Last edited:
Daily and hourly. There's demand today. Price is approaching a swing high, visible on the daily and the hourly (red). As EldnitJ has mentioned the closes have been close to each other. The swing highs and lows around the closes have been wide. To me it s hows a kind of equilibrium around which price is gyrating, more like a trading range of sort. Currently my focus is on the last swing high on the daily.

Gringo

The money, however, as you've pointed out, has been made by trading the extremes, not in the chop found at the equilibrium levels.

Db
 
Got another request for an interview, this one pertaining to how one goes about trusting software, tools, vendors, etc. I responded that one develops trust through his own efforts in studying the market, not by sorting through electronic junk mail and the claims of anonymous strangers.

The "Developing A Plan" section of the book is fifteen pages long. This is far too long for the average beginner, so I've clipped it to one page. Though this doesn't provide nearly enough information for the beginner to develop a plan, if he wants to do so, it does enumerate the requirements for developing trust in what one is doing. If the trader prefers to squander thousands of dollars on nonsense and years of wasted effort on purposeless activity, that is his choice. One is ultimately responsible for oneself.

===================

In order to succeed at trading, you must have an edge. Your edge begins with the knowledge you gain through your research and testing that a particular market behavior offers a level of predictability that provides a consistently profitable outcome over time. Without it, one is just "playing" the market in order to have something to talk about on message boards. To get it, you have to know exactly what you're looking for and what to do with it once you've found it. [clip]


The first step is to decide what kind of trader you want to be. [clip]

The second step is to decide what you're going to trade and when you're going to trade it. [clip]

The third step is to develop your system. This is the process required if you make substantial modifications to the SLA/AMT.

A system consists of (a) a set of rules that you use to select profitable positions and (b) a set of rules that you use to manage the trade once you're in it [clip].
• Developing a system begins with deciding just what it is you're looking for. Therefore, begin by studying price movement in real time (or at the end of the day through "replay", if your charting program offers it). By "study", I mean to observe it with intent, not just read about it or listen to somebody talk about it. You have to understand what you're looking at before you know what to look for. [clip]

• Develop a set of preliminary hypotheses which exploit the profit opportunities presented by these movements. [clip]

• Decide what strategy will best take advantage of what you think you've found [reversal, breakout, or retracement]. [clip]

• Carefully define the setup (the set of circumstances which you define which triggers an entry) which implements this strategy, preferably using old charts (attempting to define the setup by studying realtime charts is inefficient since you don't yet know what it is that you're looking for). [clip]

• Forward-test what you have so far, again using old charts, preferably replaying them (if replay is not available to you, then scroll through them, bar by bar). [clip]

• Paper-trade this plan, in a simulated environment, as a semi-final test, until you are satisfied that it performs at least as well as it did during the previous testing phase. [clip]

• Trade the plan using real money in real time, spending only what is absolutely necessary on "tools" and trading the minimum number of shares, contracts, etc., allowable. [clip]

• If your plan is consistently profitable in practice, increase your size to what is a comfortable level, maintaining a continuous loop of re-appraisal and re-evaluation. [clip]

And that's it. How long does it take? *click*
 
I should point out for the benefit of those who lurk but have not yet read the material that the SLAyer who trades the hourly chart is currently in long as of 0645. This represents the exit from the retracement at 0500. Those who view this as "hindsight" have not read the material and therefore don't know what a range looks like and therefore don't know what a breakout is and therefore don't know what a retracement is. Those who do know these three things will see that a retracement occurred on the hourly at 0500. It is what it is and requires no interpretation. It is in the market, not in the trader's head.

As of right now this very minute, the retracement has not been confirmed.

Db

0800: Still no confirmation. If price drops below 2.5, the odds favor ranging. If price drops below 85.75, the retracement that would have been is invalidated.

0910: Still ranging. And I should also point out, in case it's not obvious, that the "developing a plan" process described above has already been taken care of in the SLA. Those who want to take some other route or who want to make substantial changes to the SLA will have to go through the same process that I -- and Gringo and Kleft -- went through and are going through ("going through" because the SLA is continuously adaptable). It is because all of that was addressed while the SLA was under construction that I don't go into stuff like how to formulate a hypothesis. If one wants to go into that anyway, there's tons of stuff on that and on testing available online.
 
Last edited:
Keeping an eye on Tuesdays DT and weekly highs, overnight price got close before recoiling, similar behaviour to the DT, but, minutes before open price is lingering.
 
Whether you're trading tick charts or weekly charts, at some point you're going to have to come face to face with the question of how much is too much? How far can price break a line and still pull itself together for a continuation? How far becomes too far and price must instead reverse? If one is going to get out when the getting's good and stay in as long as possible, this is the sort of grunt work that has to be done. Fortunately it is not only simple but easy. Unfortunately it takes a lot of time.

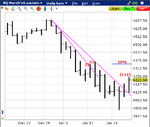
For example, using the current daily, one can see that the first break was only 22pts. The market hardly noticed. The second break was 53pts. This would seem to be more important, but, no, price staged a continuation, made a lower low, and a new line could be drawn.

Now the line has been broken by 118pts. Is this too much? Not enough? What is the daily bar's characteristic behavior (remember "characterizing your market"?)? And what are your lines in the sand going to be? A more-than-halfway rally? A break of the last swing high (which in this case is pretty much the same level)? And what happens if you wait that long and have to exit? Are you going to feel like a schmuck for not having exited earlier? What if you exit early and price makes a U-turn and a lower low? How will you describe yourself then? Chicken?

This is stuff you should do ahead of time (I'd say "have to" but nobody's going to shoot you if you don't). These are decisions you have to make, in advance, if you're going to become a confident trader. If you don't, you'll continue to travel the Land of Couldawouldashoulda.

Db
 

Attachments

  • Image34.gif
    Image34.gif
    19.6 KB · Views: 178
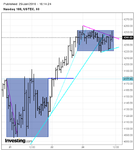
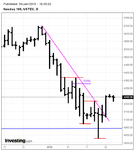
NQ hinge and trading range. Not something we haven't seen before in this thread. Looking at the daily from 4700 top shows a similar kind of a situation. There are times to sit pat if one's not in. Eventually something with greater potential is bound to show up. Stick with the lines.

One thing to note is that daily move isn't fizzling out. It's holding the gains.

Gringo
 

Attachments

  • NQ Hourly.png
    NQ Hourly.png
    36.5 KB · Views: 137
  • NQ Daily.png
    NQ Daily.png
    27.2 KB · Views: 148
Noticed Friday's volume is very weak for such a strong up bar and today looks even weaker. Short covering? Big money on the sidelines?
 
Status
Not open for further replies.
Back
Top