SLAyers' Notes

Status
Not open for further replies.
On the 5 minute chart I see 5 opportunities to buy/add positions this morning on the move up with one being a hinge. I see 2 opportunities on the 15 minute chart. Is that an accurate assessment per SLA?

A picture is worth a thousand words.
 
On the 5 minute chart I see 5 opportunities to buy/add positions this morning on the move up with one being a hinge. I see 2 opportunities on the 15 minute chart. Is that an accurate assessment per SLA?

The only opportunity to enter via SLA off the 5m was the retracement at 1025/1030.

There was no opportunity on the 15 until 1115.

No entry on the hourly was necessary as there was no reason to exit the existing short. Price is back where it started.
 
I'm not trading, just observing and note taking.

Doesn't matter. You're at work. If you're working, you're not watching. If you're watching, you're not working. None of which is any of my business, but daytrading is not the ne plus ultra.

There are many ways of making money. If one wants to implement the SLA, he can do so via hourly charts, as illustrated in the pdf in the other thread. If not, he can use indicators. Or he can automate the whole thing. But to attempt to trade price without being in a position to follow price is pretty much a self-defeating effort.
 
We do get breaks and that was when I looked at the chart. Are you saying if I trade the hourly or daily I shouldn't even observe the shorter time frames just to learn?
 
We do get breaks and that was when I looked at the chart. Are you saying if I trade the hourly or daily I shouldn't even observe the shorter time frames just to learn?

Don't try to learn to play tennis with a carpet beater.

Each interval provides its own opportunities and its own risks. If you're going to be trading an hourly interval, you need to learn how others who trade hourly bars trade, how they think. Ditto with trading daily intervals. Or 15m. They're all tick charts at bottom, but due to the defaults provided in charting programs, traders over the past twenty years have developed protocols for addressing the market in terms of their favorite intervals. Nowadays few people can imagine doing it any other way. It's all nonsense, of course, but one must yet know how these people think and how they behave. The PDH, for example, has no magical qualities. Price behaves as it does there due to the fact that it's watched by those who trade daily and hourly intervals. I watch six intervals not because I trade them all but because I want to know what all these various groups are doing and may do at this or that level.
 
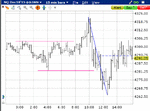
Here's what I was looking at;

chart2.jpg


On the 5 min, what I thought was a hinge on my phone turns out not to be. But the break of the trendline, maybe thats not a legitimate TL, then the retracement. ANother retracement just before 1030 and then what appears to be a BO from a small double top base. I know I said 5 but can't see the 5th one now.

 
from your post"Scalping (the SLA/AMT is not appropriate for scalping)?"
Why , what parts of SLAA is not suitable or must be tailored to facilitate quick scalping decisions?
 
None of it. Neither the SLA nor AMT is designed to facilitate scalping. The SLA is designed to make the most out of trending moves.
 
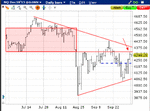
For those NQ traders who've been wondering why 4225 has been such a stumbling block:
 

Attachments

  • Wkly Sep4.gif
    Wkly Sep4.gif
    72.4 KB · Views: 417
From the attic:

As I go over a lot of the Wyckoff material,it seems to me that “they” (Wyckoff and/or people applying Wyckoff principles) analyze each and every bar to find meaning.

I can speak only to Wyckoff since so many of those who claim to apply "Wyckoff principles" to their work don't do anything of the kind. But Wyckoff did not "analyze each and every bar to find meaning". The bar was simply a means by which he told a story.

What you get out of all this depends on what you want from it. Think of it in terms of learning how to operate a car. You can buy, rent, or borrow a car from somebody and arrange for that somebody to show you how to make the car go, how to make it stop, how to make it go left and right. At some point, you may become more interested in the why and watch somebody rebuild an engine or transmission or even assemble an entire car. If you become even more interested, you may end up building a car yourself.

Or, if the mechanical is not appealing, look at the process in terms of fine art. You can go to a gallery and buy something. Or if you want to know more of the process, you can watch somebody create the work. Eventually, you may study and learn how to create one yourself.

Applying these analogies to understanding price action should not be a great leap. Think about it.

I would say I am in the "building the car" stage. To me, this stage forces me to question some or all the material (and with "material" I also include looking at tons of charts, EOD as that is what I trade) I go over in order to develop a deeper understanding. Sometimes what I read makes complete sense, but other times it makes no sense at all. I don't want to take a shortcut with someone telling me to put on a trade here or here, but I am still (and will probably always be since your never reach complete mastery...) at a stage where I need some 3rd party input to develop a deeper understanding.

You may be in the "building the car" stage, but it is not necessarily the Wyckoff model. The apparent emphasis on bar-by-bar analysis -- or candle-by-candle -- in some of the material will mislead those who go no deeper and motivate them to study bars/candles, looking for volume bars of given heights and price bars/candles of given lengths and mixing all of that with the positions of closes in order to find guidance for subsequent trades, even to the extent of developing mechanical systems, even software.

Wyckoff's approach, however, is based on (a) continuous price movement that (b) moves in waves that are determined by (c) imbalances in supply and demand, or buying pressure and selling pressure. The statements that he makes with regard to bars are not the result of studying bars but of twenty years of following the tape. The charts or "graphs" he used were merely summaries of everything he learned through watching the tape. Anyone who attempts to develop an understanding of the continuity of price movement and its wave structure without actually looking at it is going to be at a disadvantage when compared to the individual who watches price move tick by tick and who watches volume ebb and flow along with those price movements.

Building the Wyckoff car, then, is not a matter of assembling volume bars of varying heights with price bars of varying lengths and welding them with closes in varying positions. One might come up with something that holds together, but it wouldn't go anywhere (this helps to account for the thousands of posts which can be made with regard to this sort of variant with the net result that participants still don't understand it and still can't make it "work"). Building this particular car requires a familiarity with and an understanding of the continuous movement of price. Unless and until the individual develops this understanding, the Wyckoff approach will likely be very frustrating.
 
When trading longer time frames like the daily/hourly, we noticed yesterday Price was halted at S/R. If expecting a reversal, at what point does one decide to short? As soon as price ticks lower this morning, do you go down to a 15 min chart and wait for a test? Or do you wait for a break of the TL like below at the shaded oval? Or wait for another test of that TL which could end up being 20 points lower?

buy%20point.jpg

Your questions are valid and are based on risk tolerance of the person trading. Once you have the fear issue resolved a point here and there isn't such a big deal. If you are using pure SLA as shown in the pdf then you ought to read it again. The entries and exits are quite clearly shown as far as I can recall.

Gringo
 
While trading is simple, it is not easy, and beginners often make it more difficult than it already is by virtue of the choices they make.

Inattentiveness is a common cause of couldawouldashoulda. The most obvious solution to this is to determine just what one's attention span is, i.e., for how long a period one can maintain maximum attention and efficiency, then trade for only that length of time. However, it's not all about the trader. The market has something to say about all of this as well. And that's where Wyckoff comes in: find the market or instrument that's most likely to (a) move, (b) move the farthest, (c) move the fastest.

Say for example that price moves at or about the open from R to S in only 45m. It then rallies back to R in 30m. It then takes three times as long, 90m, to revisit S. then three hours to get back to R. So if one has attentiveness issues, when ought he to be trading? When is the market most ready to move? When does it move the farthest the fastest?

One can, of course, elect to trade during that period of the day which is most inappropriate for his "style" , but doing so will involve unnecessary struggle, which will often lead to "fear", at which point the trader will focus on dealing with his fear, when a more pertinent concern is the choice of the interval in which he's trading.

The fear, in other words, is often an irrelevance, the result not of deep-seated neuroses which fatten the pockets of psychologists and counselors but rather of poor choices. If the trader were to alter his trading environment, he would very likely find that his fear evaporates.
 
Status
Not open for further replies.
Back
Top